|
:
Tuatua School Electricity
|
|
||||
|
Questions / instructions:
|
||||
| % responses | ||||
|
y8
|
||||
|
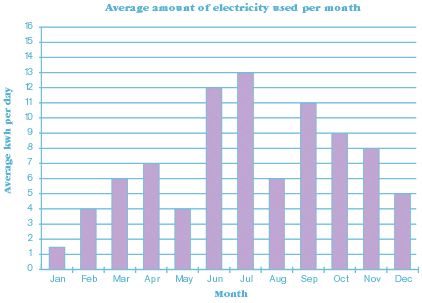
1. Which months had an average of more than 10kwh per day? June, July, September |
73
|
|||
|
2. What was the average kwh use per day for June? 12 |
79
|
|||
|
3a. Which month has the lowest use of electricity per day? January |
97
|
|||
|
3b. Why do you think that month was lowest? Eg. school closed, no need for heat and light |
57
|
|||
[ top of the page | Graphs, Tables and Maps Report 1995 ]