|
Approach: Station |
| Focus:
Converting a double
bar graph into a table.
|
 |
3.8Megs |
Resources: Ruler,
pencil. |
|
Questions / instructions:
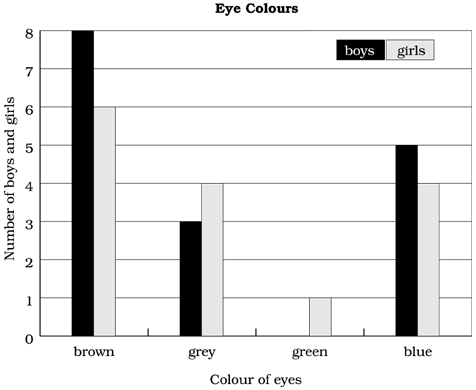
Look at the bar graph called
Eye Colours. The bar graph shows the different eye colours of boys and girls in
Room 3.
Make a table showing eye
colours of boys and girls in Room 3.
|
|
|
%
responses |
|
y8
|
|

|
.
|
.
|
|
presented
information in a table format
|
57
|
|
separate
rows or columns for boys and girls
|
53
|
|
separate
rows or columns for the four eye colours
|
55
|
|
all
cell numbers correct
|
49
|
Commentary:
Converting this graph
into a 2x4 table proved a substantial challenge for year 8 students. About half
completed the task well. |