|
|
|
|||||
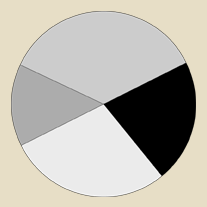
| Focus: Labelling a pie graph appropriately. | |||||
|
|||||
|
Questions / instructions: |
|||||
| % responses | |||||
|
y4
1999(1995) |
y8
1999(1995) |
||||
 |
.
|
.
|
.
|
||
|
top
segment labelled science
|
92(55)
|
98(91)
|
|||
|
right
segment labelled maths
|
84(61)
|
93(92)
|
|||
|
bottom
segment labelled sport
|
85(59)
|
93(93)
|
|||
|
left
segment labelled art
|
91(68)
|
97(95)
|
|||
|
Total
score: 4
2–3 0–1 |
82(52)
11(14) 7(34) |
92(89)
6(6) 2(5) |
|||
|
Commentary: This task shows a dramatic improvement in the performance of year 4 students between 1995 and 1999. Thirty percent more year 4 students got the task completely right in 1999. There was little change for year 8 students. Both year 4 and year 8 students were very successful with this task in 1999. Ten percent more year 8 than year 4 students placed all four labels correctly. |
|||||