|
|
|
|||||
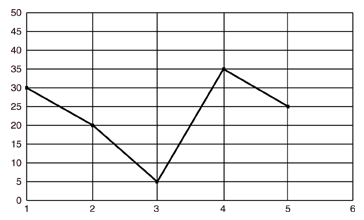
| Focus: Interpreting a line graph | |||||
|
|||||
|
Questions / instructions: |
|||||
| % responses | |||||
|
y4
1999(1995) |
y8
1999(1995) |
||||
|
|
1.
How many ticks did Toni get on week 1?
|
66(59)
|
92(89)
|
||
|
30
|
|||||
|
2.
Which week did Toni not get a treat?
|
43(37)
|
73(76)
|
|||
|
week
3
|
|||||
|
3.
Which week did Toni get 25 ticks?
|
56(56)
|
88(89)
|
|||
|
week
5
|
|||||
|
4.
How many treats could Toni choose on week 2?
|
45(42)
|
78(85)
|
|||
|
2
|
|||||
|
Total
score: 4
3 2 0 -1 |
22(21)
19(15) 23(23) 36(39) |
62(65)
18(19) 12(9) 8(7) |
|||
| Commentary: For both year 4 and year 8 students, there was little change over four years in their ability to interpret this line graph. Forty percent more year 8 than year 4 students got all the questions correct in 1999. |
|||||