|
||||||||||
|
|||||||||||||
|
|||||||||||||
| %
responses 2003 ('99) |
|||||||||||||
| y4
|
y8 |
||||||||||||
| 1.
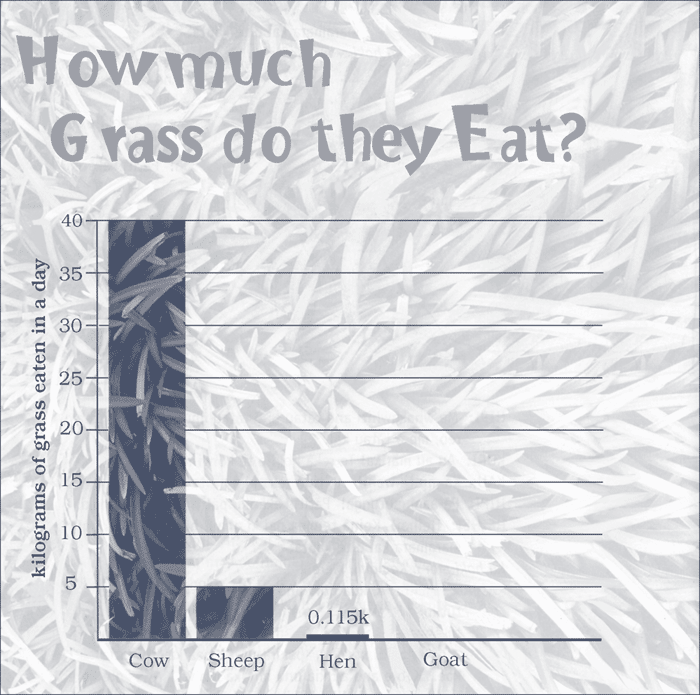
How much grass does a cow eat? |
40
|
88
(90) |
97
(97) |
||||||||||
40kg
per day |
4
(6) |
27
(23) |
|||||||||||
40kg
|
50
(46) |
59
(62) |
|||||||||||
| 2.
A goat eats 10 kilograms of grass a day. Put this on to the graph. |
correct
height |
80
(86) |
95
(96) |
||||||||||
correct
shape |
82
(90) |
97
(97) |
|||||||||||
shaded
|
63
(83) |
85
(91) |
|||||||||||
Total
score: |
6
|
3
(5) |
25
(22) |
||||||||||
5
|
39
(38) |
54
(57) |
|||||||||||
3–4
|
38
(46) |
18
(18) |
|||||||||||
1–2
|
15
(9) |
2
(2) |
|||||||||||
0
|
5
(2) |
1
(1) |
|||||||||||
| Commentary: Year 4 students in 2003 were less successful in completing a bar graph than their peers in 1999, particularly in shading the bar appropriately. The performance for year 8 students was similar in 1999 and 2003. Only a small proportion of year 4 and year 8 students interpreted the graph using the units of the scale. |
|||||||||||||