| Approach: One
to one |
Level:
Year 8 |
|
| Focus:
Interpreting
a graph
|
| Resources:
Graph
|
 |
148KB |
|
|
Questions/instructions:
Give student graph.
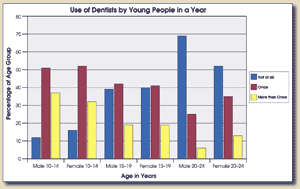
Here is a graph about people’s visits to the dentist.
I’m going to ask you some questions, and you will need to
look at the graph to find the answers. |

[click on graph to enlarge] |
|
| |
%
responses
2003 ('99) |
| y8 |
| 1.
What does the graph show about the number of visits to the dentist as
people get older? |
people
go less often as they get older |
64
(64) |
| 2.
Which group of people have the smallest number of visits to the dentist?
|
males
20-24 years old |
66
(69) |
| 3.
What percentage of males aged 10–14 go to the dentist once a year?
|
51–52%
|
58
(62) |
4.
What are three things this graph tells about dentist visits by females
aged 10–14?
|
3
points made
|
41
(43) |
2
points made |
13
(12) |
1
point made |
15
(13) |
| |
|
Total
score:
|
6
|
19
(21) |
4–5
|
34
(33) |
2–3
|
29
(29) |
0–1
|
18
(17) |
Commentary:
Year 8 students in 2003 interpreted a graph with the same level of success
as year 8 students in 1999. About 20 percent of students answered all
questions accurately. |