| Approach: Station |
Level:
Year 4 |
|
| Focus:
Interpreting
a map
|
| Resources:
Map |
 |
160KB |
|
|
Questions/instructions:
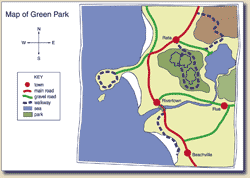
Look at the map of Green Park. |
 [click
on map to enlarge]
 |
|
| |
%
responses
2003 ('99) |
| y4
|
| 1.
How many towns are shown on the map? |
4
|
91
(92) |
| 2.
How many walkways are shown on the map? |
4
|
65
(72) |
| 3.
Does the map show more sea or land? |
land
|
65
(69) |
| 4.
What does the line from Rata to Beachville mean? |
main
road |
51
(59) |
| 5.
Is Rata north or south of Rivertown? |
north
|
64
(70) |
| 6.
Which town will you have to go through when going from Rua to Rata? |
Rivertown
|
87
(86) |
| |
|
| Total
score:
|
6
|
17
(23) |
|
5
|
29
(33) |
|
4
|
27
(25) |
|
2–3
|
23
(17) |
|
0–1
|
3
(2) |
Commentary:
The ability of year 4 students in 2003 to interpret a map is similar to
that of students in 1999. About 50 percent of students got five or six
of the questions correct. |