The
Project directors acknowledge the vital support and contributions of
many people to this report, including:
•
the very dedicated staff of the Educational Assessment Research Unit
• Lisa Rodgers and other staff members of the Ministry of Education
• members of the Project’s National Advisory Committee
• principals and children of the schools where tasks were trialled
• principals, staff and Board of Trustee members of the 252
schools included in the 2003 sample
• the 2936 children who participated in the assessments and
their parents
• the 100 teachers who administered the assessments to the children
• the 45 senior tertiary students who assisted with the marking
process
• the 170 teachers who assisted with the marking of tasks early
in 2004.
New Zealand’s
National Education Monitoring Project commenced in 1993, with the task
of assessing and reporting on the achievement of New Zealand primary
school children in all areas of the school curriculum. Children are
assessed at two class levels: year 4 (halfway through primary education)
and year 8 (at the end of primary education). Different curriculum areas
and skills are assessed each year, over a four year cycle. The main
goal of national monitoring is to provide detailed information about
what children can do so that patterns of performance can be recognised,
successes celebrated and desirable changes to educational practices
and resources identified and implemented.
Each year, small random samples of children are selected nationally,
then assessed in their own schools by teachers specially seconded and
trained for this work. Task instructions are given orally by teachers,
through video presentations, on laptop computers, or in writing. Many
of the assessment tasks involve the children in the use of equipment
and supplies. Their responses are presented orally, by demonstration,
in writing, in computer files, or through submission of other physical
products. Many of the responses are recorded on videotape for subsequent
analysis.
The use of many tasks with both year 4 and year 8 students allows comparisons
of the performance of year 4 and 8 students in 2003. Because some tasks
have now been used twice, in 1999 and again in 2003, trends in performance
across the four-year period can also be analysed.
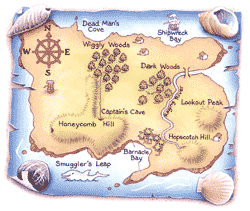
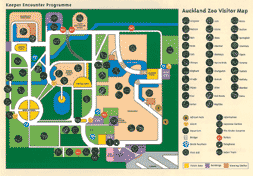
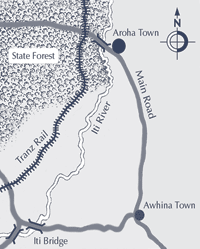
| ASSESSING
SKILLS IN THE USE OF GRAPHS, TABLES AND MAPS |
In 2003, the first
year of the third cycle of national monitoring, three areas were assessed:
science, art, and the use of graphs, tables and maps. This report presents
details and results of the assessments of students’ skills in
the use of graphs, tables and maps. Understanding and using information
presented in the form of graphs, tables and maps is an important part
of everyday life in our community. This report highlights two aspects
of the use of graphs, tables and maps: extracting and interpreting information,
and constructing or completing graphs, tables and maps.
|
INTERPRETATION OF GRAPHS,
TABLES AND MAPS |
Chapter
3 focuses on extracting and interpreting information from a wide
variety of graphs, tables and maps. Averaged across 116 task components
used with both year 4 and year 8 students, 76 percent of year 8 students
produced correct responses compared to 52 percent of year 4 students.
This indicates that, on average, students have made substantial progress
between year 4 and year 8 in the skills assessed by the tasks. Nearly
one third of the task components were answered successfully by at least
90 percent of year 8 students. Some of the largest differences between
year 4 and year 8 students occurred on tasks requiring students to interpret
timetables.
Seven trend tasks involving 37 task components were administered to
year 4 students in both the 1999 and 2003 assessments. Averaged across
all 37 components, two percent fewer students succeeded in 2003 than
in 1999. This indicates a very small decline in performance for year
4 students over the four-year period. Ten trend tasks involving 60 task
components were administered to year 8 students in both the 1999 and
2003 assessments. Averaged across all 60 components, one percent fewer
students succeeded in 2003 than in 1999. This is not a meaningful change
in performance for year 8 students over the four-year period.
|
CONSTRUCTING
OR COMPLETING GRAPHS, TABLES AND MAPS |
The focus of Chapter
4 is constructing or completing graphs, tables and maps. Averaged
across 68 task components used with both year 4 and year 8 students,
63 percent of year 8 students produced correct responses compared to
39 percent of year 4 students. This indicates that, on average, students
have made substantial progress between year 4 and year 8 in the skills
assessed by the tasks. A quarter of these task components were answered
successfully by at least 90 percent of year 8 students. Students at
both levels were least successful in providing titles and appropriate
labels for axes and values, seeming to believe that it was sufficient
to display the data.
Three trend tasks involving a total of 14 components were administered
to year 4 students in both the 1999 and 2003 assessments. Averaged across
the 14 components, 8 percent fewer students succeeded in 2003 than in
1999. Four trend tasks involving 25 task components were administered
to year 8 students in both the 1999 and 2003 assessments. Averaged across
the 25 components, one percent fewer students succeeded in 2003 than
in 1999, an insignificant change.
Chapter
5 reports the results of analyses that compared the performance
of different demographic subgroups. School type (full primary or intermediate),
school size, community size, geographic zone and student gender did
not seem to be important factors predicting achievement on the graphs,
tables and maps tasks. The other four factors revealed more substantial
differences.
 There
were statistically significant differences in the performance of students
from low, medium and high decile schools on 51 percent of the tasks
at year 4 level and 73 percent of the tasks at year 8 level (the comparable
figures in 1999 were 52 percent and 84 percent). There
were statistically significant differences in the performance of students
from low, medium and high decile schools on 51 percent of the tasks
at year 4 level and 73 percent of the tasks at year 8 level (the comparable
figures in 1999 were 52 percent and 84 percent).
In earlier NEMP reports, the performance of Mäori students was
compared to that of all other students. Starting with the 2003 reports,
three groups are now distinguished: Mäori students, Pasifika students
and all other students (described as Pakeha students). This change prevents
satisfactory direct comparisons with the results from 1999.
For the comparisons of Pakeha with Mäori, Pakeha with Pasifika
students, and students for whom the predominant language at home was
English with those for whom it was not, effect sizes were used. Effect
size is the difference in mean (average) performance of the two groups,
divided by the pooled standard deviation of the scores on the particular
task.
Pakeha students scored statistically significantly higher than Mäori
students on 49 percent of year 4 tasks and 71 percent of year 8 tasks,
with average effect sizes of 0.33 and 0.40 respectively. These can be
described as moderate effect sizes.
Pakeha students scored statistically significantly higher than Pasifika
students on 59 percent of year 4 tasks and 78 percent of year 8 tasks,
with average effect sizes of 0.50 and 0.70 respectively. These can be
described as large effect sizes.
Compared to students for whom the predominant language at home was English,
students from homes where other languages predominated scored statistically
significantly lower on 43 percent of year 4 tasks, reducing to 27 percent
of year 8 tasks. The corresponding mean effect sizes were 0.35 and 0.27,
which can be described as moderate effect sizes
|
SUMMARY OF PERFORMANCE TRENDS |
 An
indication of overall trends in performance across the four-year period
between 1999 and 2003 can be obtained by looking at the patterns of
change across all of the trend tasks. Averaged across 51 components
of the year 4 trend tasks, 4 percent fewer students succeeded in 2003
than in 1999. Averaged across 85 components of the year 8 trend tasks,
one percent fewer students succeeded in 2003 than in 1999. An
indication of overall trends in performance across the four-year period
between 1999 and 2003 can be obtained by looking at the patterns of
change across all of the trend tasks. Averaged across 51 components
of the year 4 trend tasks, 4 percent fewer students succeeded in 2003
than in 1999. Averaged across 85 components of the year 8 trend tasks,
one percent fewer students succeeded in 2003 than in 1999.
The report on the 1999 graphs, tables and maps assessments reported
trends between 1995 and 1999, with an average gain over that four-year
period of six percent on year 4 trend task components and a decline
of one percent on year 8 trend task components. Taken together, these
two sets of trend results suggest little change in performance overall,
at either year level, for the eight year period from 1995 to 2003.
|