|
|||||||||||||
|
|||||||||||||
%
responses 2007 ('03) |
|||||||||||||
y4 |
y8 |
||||||||||||
|
|||||||||||||
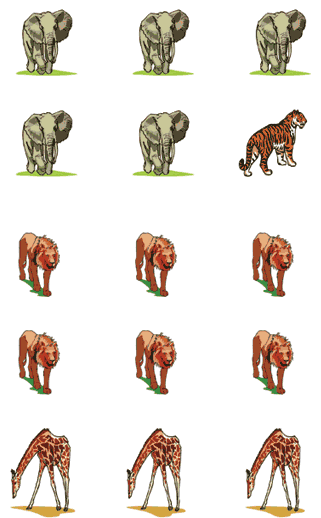
5 elephants: |
number and convention correct | 85 (84) |
97 (95) |
||||||||||
| number correct | 3 (5) |
0 (3) |
|||||||||||
3 giraffes: |
number and convention correct | 89 (91) |
97 (98) |
||||||||||
| number correct | 2 (2) |
0 (1) |
|||||||||||
1 tiger: |
number correct | 89 (87) |
96 (98) |
||||||||||
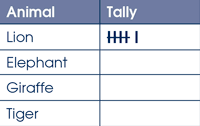
2. Use the tally chart to help you draw a bar graph of this information on the next page.
|
|||||||||||||
| Title: (“Animal Add Ups”/ “How many Animals?” or similar) | 47 (46) |
79 (80) |
|||||||||||
| Position of title: |
above |
49 (47) |
79 (80) |
||||||||||
below |
1 (0) |
1 (1) |
|||||||||||
| “Animals” axis: |
appropriate axis label and
all animal names |
3 (5) |
41 (41) |
||||||||||
appropriate axis label,
not all animal names |
1 (0) |
2 (3) |
|||||||||||
all animal names,
but no appropriate axis label |
44 (43) |
46 (48) |
|||||||||||
Number axis:
|
appropriate axis label and appropriate numbering (starting at zero) |
1 (3) |
39 (43) |
||||||||||
appropriate axis label, not appropriate number labelling |
1 (1) |
5 (4) |
|||||||||||
appropriate number labelling, but no appropriate axis label |
32 (30) |
39 (38) |
|||||||||||
| Bars of graph: |
all bars drawn to correct height (or matching tally numbers) |
42 (42) |
82 (87) |
||||||||||
two or three bars drawn to correct height (or matching tally numbers) |
6 (7) |
6 (6) |
|||||||||||
| Placement of bars: | bars separated |
31 (29) |
55 (53) |
||||||||||
bars together |
25 (19) |
40 (41) |
|||||||||||
Total
score: |
14–18 |
13 (11) |
56 (59) |
||||||||||
11–13 |
25 (23) |
27 (28) |
|||||||||||
8–10 |
24 (27) |
12 (9) |
|||||||||||
5–7 |
27 (28) |
4 (4) |
|||||||||||
0–4 |
13 (11) |
1 (1) |
|||||||||||
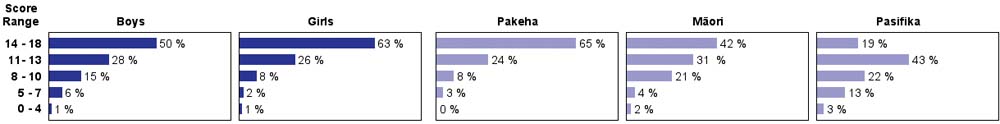
| Subgroup Analysis [Click on charts to enlarge] : |
Year 4 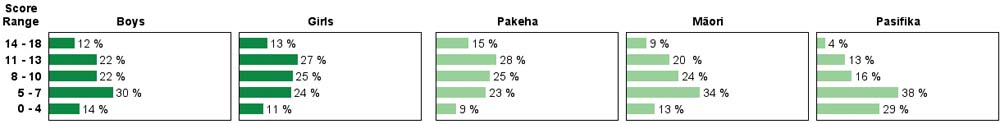 |
||
| Commentary: |
| Most year 4 and year 8 students were successful in tallying information, but many year 4 students had difficulty translating those tallies into a bar graph. Year 8 students were much more successful at that task. Students at both years tended to ignore the need for labels and titles on their graphs. Performance in 2003 and 2007 was very similar. On average, Pasifika students scored lower than Mäori students who, in turn, were lower than Pakeha students. |