|
||||||||||||||||
|
||||||||||||||||
%
responses 2007 ('03) |
||||||||||||||||
y8 |
||||||||||||||||
sectors of the circle used |
92 (94) |
|||||||||||||||
exactly four sectors |
75 (82) |
|||||||||||||||
four sectors showing 5 mins, 10 mins,
15 mins, 10 mins (fairly accurately) |
69 (76) |
|||||||||||||||
four sectors in correct sequence |
70 (74) |
|||||||||||||||
“getting ready” (5 mins) started at 0/40 |
66 (71) |
|||||||||||||||
| Labelling issues: |
key boxes labelled with four activities |
55 (69) |
||||||||||||||
key boxes filled (or left white) to match
each sector of pie graph |
77 (78) |
|||||||||||||||
sectors labelled by other means than
key/or in addition to key |
12 (12) |
|||||||||||||||
sector proportions correct and labelled
accurately (by key or other means) |
54 (60) |
|||||||||||||||
Total
score: |
8–9 |
41 (49) |
||||||||||||||
7 |
12 (11) |
|||||||||||||||
6 |
11 (12) |
|||||||||||||||
5 |
6 (7) |
|||||||||||||||
0–4 |
30 (22) |
|||||||||||||||
| Subgroup Analysis [Click on charts to enlarge] : |
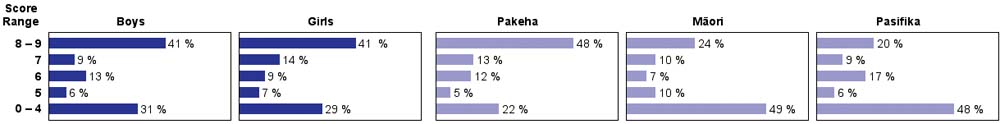
| Commentary: |
| Almost half of the year 8 students were quite successful at making a pie graph from data presented in a table. The most common problem came in properly labelling their graphs. There was a slight decline in performance from 2003. Mäori and Pasifika students performed similarly, but markedly less well than Pakeha students, on average. |