|
|||||||||||||
|
|||||||||||||
%
responses |
|||||||||||||
y4 |
y8 |
||||||||||||
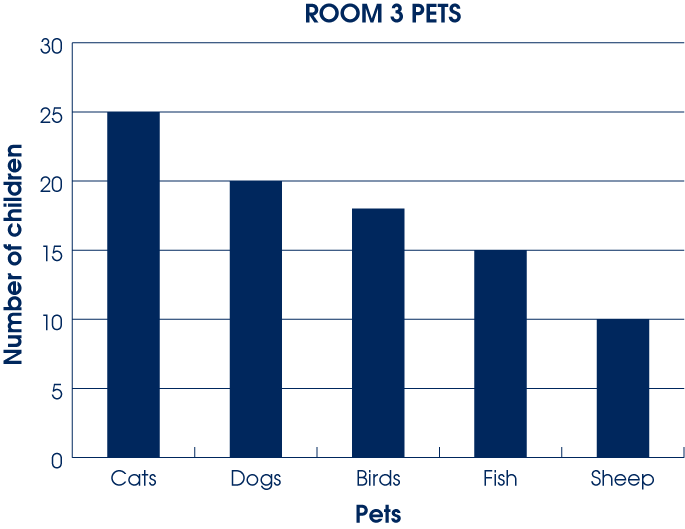
| 1. What pet did most children have? | cat |
95 |
99 |
||||||||||
| 2. How many children had fish? | 15 |
87 |
99 |
||||||||||
| 3. More children had dogs than sheep. How many more had dogs? | 10 |
45 |
77 |
||||||||||
Total
score: |
3 |
44 |
77 |
||||||||||
2 |
41 |
22 |
|||||||||||
1 |
13 |
0 |
|||||||||||
0 |
2 |
1 |
|||||||||||
| Subgroup Analysis [Click on charts to enlarge] : |
Year 4 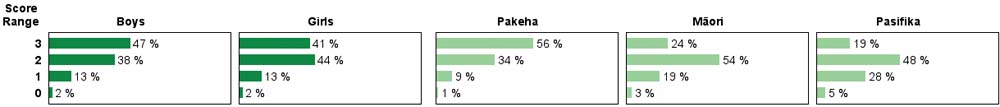 |
||
| Commentary: |
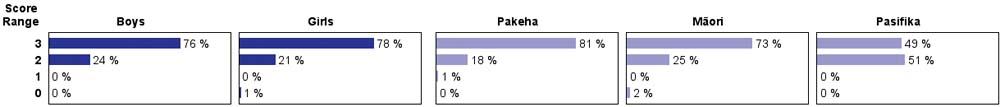
| Students were quite successful at reading a simple graph. The one question that asked for a calculation in addition to reading numbers from the graph proved to be somewhat difficult for year 4 students. Mäori and Pasifika year 4 students performed similarly, but Mäori students outperformed Pasifika students at year 8. |