|
|||||||||||||
|
|||||||||||||
%
responses 2007 ('03) |
|||||||||||||
y4 |
y8 |
||||||||||||
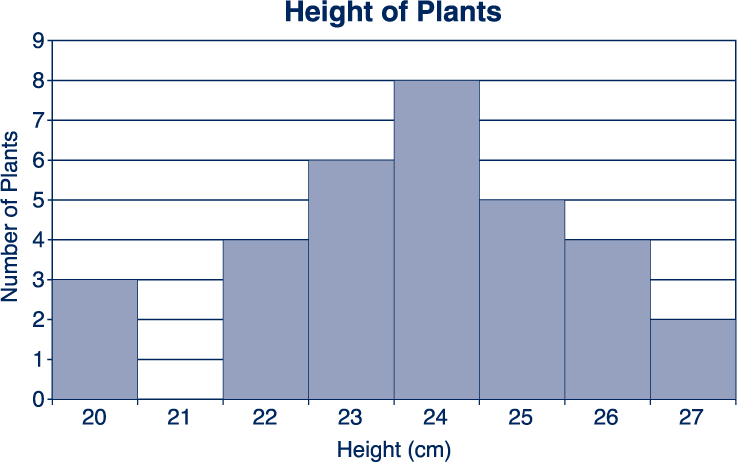
| 1. How many plants are 20cm tall? | 3 |
48 (60) |
84 (88) |
||||||||||
| 2. What is the height of the tallest plant? |
27cm |
9 (7) |
40 (30) |
||||||||||
27 |
5 (5) |
6 (11) |
|||||||||||
24cm or 24 |
48 (48) |
46 (50) |
|||||||||||
8 |
21 (30) |
4 (6) |
|||||||||||
| 3. How many plants is the class growing? | 32 |
14 (18) |
56 (58) |
||||||||||
Total
score: |
3 |
5 (6) |
33 (30) |
||||||||||
2 |
13 (17) |
32 (36) |
|||||||||||
1 |
34 (40) |
24 (25) |
|||||||||||
0 |
48 (38) |
12 (9) |
|||||||||||
| Subgroup Analysis [Click on charts to enlarge] : |
Year 4 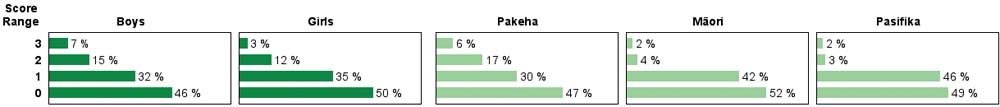 |
||
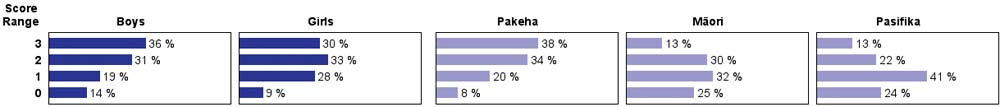
| Commentary: |
| Year 8 students were moderately successful in reading the data from a simple graph, while year 4 students had much less success. Performance in 2003 and 2007 was similar. Boys and girls performed similarly, while at year 8 level Pakeha students did substantially better than Mäori or Pasifika students. |