The Project directors acknowledge the vital support and contributions of many people to this report, including: |
||||||||||||||||||||||
 |
•
the very dedicated staff of the Educational Assessment Research Unit • Lisa Rodgers and other staff members of the Ministry of Education • members of the Project’s National Advisory Committee • members of the Project’s Health and Physical Education Advisory Panel • principals and children of the schools where tasks were trialled • principals, staff, and Board of Trustee members of the 283 schools included in the 2002 sample • the 3137 children who participated in the assessments and their parents • the 107 teachers who administered the assessments to the children • the 44 senior tertiary students who assisted with the marking process • the 204 teachers who assisted with the marking of tasks early in 2002. |
|||||||||||||||||||||
New Zealand’s
National Education Monitoring Project commenced in 1993, with the task
of assessing and reporting on the achievement of New Zealand primary
school children in all areas of the school curriculum. Children are
assessed at two class levels: year 4 (halfway through primary education)
and year 8 (at the end of primary education). Different curriculum areas
and skills are assessed each year, over a four-year cycle. The main
goal of national monitoring is to provide detailed information about
what children can do so that patterns of performance can be recognised,
successes celebrated, and desirable changes to educational practices
and resources identified and implemented.
Chapter 2 presents the NEMP framework for health and physical education. It has as its central organizing theme Personal and community well-being through enhancing health practices and physical education. Three areas of knowledge and understandings are identified, together with three clusters of skills, and students’ attitudes and involvement.
Chapter
3 presents the results that students achieved on 25 tasks relating
to personal health and physical development.
Averaged across 84 task components administered to both year 4 and year
8 students, 11 percent more year 8 than year 4 students succeeded with
these components. Trend analyses showed no meaningful change since 1998
for year 4 or year 8 students. Averaged across 64task
components attempted by year 4 students in both years, the same percentage
of students succeeded in 2002 as in 1998. At year 8 level, with 76 task
components included in the analysis, 1 percent fewer students on average
succeeded with the task components in 2002 than in 1998.
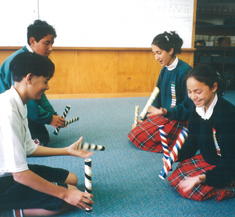
Chapter 4 reports the results achieved on 24 tasks involving movement concepts and motor skills. The activities often involved the use of equipment, such as balls, bats, and skipping ropes, in addition to physical coordination. Averaged across 88 task components administered to both year 4 and year 8 students, 16 percent more year 8 than year 4 students succeeded with these components. The smallest differences generally occurred on task components that focused on technique, with the largest differences on task components that emphasized speed and precision. Trend analyses showed no meaningful change since 1998 for year 4 or year 8 students, with just a hint of a decline for year 8 students. Averaged across 37 task components attempted by year 4 students in both years, the same percentage of students succeeded in 2002 as in 1998. At year 8 level, with 39 task components included in the analysis, 2 percent fewer students on average succeeded with the task components in 2002 than in 1998.
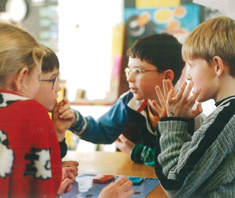
Chapter 5 presents the results for 14 tasks about relationships with other people. Students were asked to show what they understood about how the attitudes, values, actions, and needs of people interact, and to suggest strategies for dealing with relationship problems. Averaged across 23 task components administered to both year 4 and year 8 students, 14 percent more year 8 than year 4 students succeeded with these components. Trend analyses showed no meaningful change since 1998 for year 4 or year 8 students, but with a hint of an improvement for year 8 students. Averaged across 9 task components attempted by year 4 students in both years, 1 percent more students succeeded in 2002 than in 1998. At year 8 level, with 10 task components included in the analysis, 3 percent more students on average succeeded with the task components in 2002 than in 1998.
Chapter 6 presents the results for four tasks relating to healthy communities and environments. The stated aim of this strand of the curriculum is for students to participate in creating healthy communities and environments by taking responsible and critical action. This is not an easy area in which to create assessment tasks that can stand by themselves, separate from class programmes and activities and children’s life experiences. Averaged across 8 task components administered to both year 4 and year 8 students, 7 percent more year 8 than year 4 students succeeded with these components. No trend information is available, because none of the 2002 tasks was used in 1998.
Chapter
7 reports the results of surveys of students’ attitudes about
and involvement in health and physical education activities. Physical
education was the favourite of twelve curriculum areas for year 8 students,
and the second most popular (after art) for year 4 students. Health
was last equal in popularity at both year levels, yet less than 20 percent
of students at both levels expressed negative attitudes towards studying
it. Enthusiasm for learning about health declined a little for year
4 students between 1998 and 2002, with little change for year 8 students.
This was reversed for physical education, with a small drop at year
8 level but no change at year 4 level. Only 39 percent of year 4 students
and 33 percent of year 8 students believed their class did things that
helped them learn about health “lots” or “quite a
lot”.
Chapter
8 reports the results of analyses that compared the performances
of different demographic subgroups. School size, school type (full primary
or intermediate), community size, geographic zone and student ethnicity
(Mäori/non-Mäori) did not seem to be important factors predicting
achievement in health and physical education, or attitudes towards them.
Chapter
9 reports the results of analyses of the achievement of Pacific
Island students. Additional sampling of schools with high proportions
of Pacific Island students permitted comparison of the achievement of
Pacific Island, Mäori and “other” children attending
schools that have more than 15 percent Pacific Island students enrolled.
The results apply only to such schools, but it should be noted about
75 percent of all Pacific students attend schools in this category.
|
||||||||||||||||||||||