|
|||||
|
|||||
Introduction: Attitudes and Motivation The national monitoring assessment programme recognises the impact of attitudinal and motivational factors on student achievement in individual assessment tasks. Students’ attitudes, interests and liking for a subject have a strong bearing on progress and learning outcomes. Students are influenced and shaped by the quality and style of curriculum delivery, the choice of content and the suitability of resources. Other important factors influencing students’ achievements are the expectations and support of significant people in their lives, the opportunities and experiences they have in and out of school, and the extent to which they have feelings of personal success and capability. |
||||||||||||||||||||||||||||||||||||
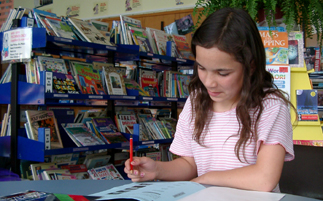
The
Information Skills survey sought information from students about their
strategies for, involvement in, and enjoyment of information gathering
activities. The survey was administered to the students in an independent
tasks session (four students working individually on tasks, supported
by a teacher). |
||||||||||||||||||||||||||||||||||||
Finding information and seeking assistance One item asked students to indicate where they usually go when trying to find information. They could tick up to three options. Their responses are shown here, in order of popularity for Mäori students in general education. Compared to Mäori students in general education, the students in Mäori immersion settings were much less likely to try to find information in a library and somewhat less likely to search on the Internet. Conversely, they were much more likely to ask a friend, teacher or parent. |
|
|||||||||||||||||||||||||||||||||||
| Another
item asked students to indicate what they do when they can’t find
information they need. They could tick up to three options. Their responses
are shown adjacent, in order of popularity for Mäori students in
general education. Compared to Mäori students in general education, students in Mäori immersion settings were much more likely to keep looking (without specific help) and a little more likely to ask the teacher, but less likely to ask a librarian. |
|
|||||||||||||||||||||||||||||||||||
Using library catalogues A pair of questions (questions 10 and 11) asked students if they had used library card or computer catalogues. Students in Mäori immersion settings were substantially less likely to have used a computer catalogue. This probably reflects the limited availability of fiction and non-fiction books in Mäori, and the correspondingly small collections in school libraries for these students. The earlier survey questions have also indicated less reliance on use of libraries. Rating items The remaining seven items used a rating format. The percentages of students choosing each response to these five questions are shown in the table below. |
|
|||||||||||||||||||||||||||||||||||
|
Compared to Mäori
students in general education, students in Mäori immersion settings
indicated that they more frequently had really interesting studies to
find information for, were more positive about hunting for information
and their ability to do so, and also were more positive about sharing
their information with others or writing it down. More than half indicated
that they voluntarily looked for information “heaps” or
“quite a lot”, whereas only 25 percent of Mäori students
in general education chose these options. |
||||||||||||||||||||||||||||||||||||
| Information
Skills Survey percentages — Mäori students in general education Mäori Immersion students |
|||||
| w
much do you like doing music at school? |
heaps | quite a lot | sometimes | never | |
| 1. | How
often do you have to find information for a study (research topic/project)? |
17 4 | 41
48 |
40 48 | 2 0 |
| a | |||||
| 2. | How
often do you have a really interesting study for which you have to find
information? |
7 27 | 25
42 |
63 31 | 5 0 |
| 3. | How
often do you look for information because you want to, not because you’ve
been told to? |
10 12 | 15
40 |
50 44 | 25 4 |
| 4. | How
much do you like hunting for information? |
14 31 | 52
65 |
27 4 | 7 0 |
| 5. |
How good do you think you are at hunting for information? |
18 35 | 51
63 |
25 2 | 6 0 |
| 6. |
How much do you like sharing with others the information you find? |
40 62 | 38
19 |
17 17 | 5 2 |
| 7. |
How much do you like writing down what you find out? |
29 46 | 31
29 |
32 21 | 8 4 |
| Continue to Social Studies Survey >> |