|
||||||||||
|
|||||||||||||
Questions/instructions:
|
|||||||||||||
| %
responses |
|||||||||||||
| 1.
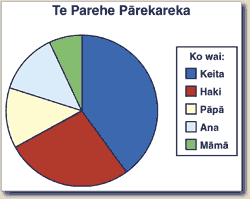
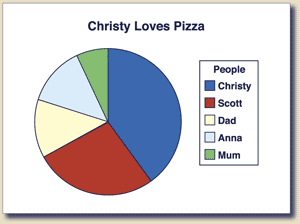
Nä wai i kai te wähanga rahi rawa? Who ate the most? |
Christy
|
96 |
|||||||||||
| 2.
Nä wai i kai te wähanga iti rawa? Who ate the least? |
Mum
|
96 |
|||||||||||
| 3.
He örite te rahi o ngä wähanga i kainga e wai? Who ate equal amounts? |
Anna
and Dad |
96 |
|||||||||||
4.
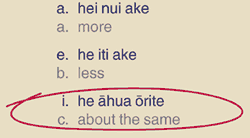
Ko te wähanga i kainga e Haki, he nui ake, he iti ake, he örite
ränei ki ngä wähanga e rua a Päpä räua
ko Ana?
|
c |
|
|||||||||||
Total
score: |
4
|
43 |
|||||||||||
3
|
53 |
||||||||||||
2
|
4 |
||||||||||||
1
|
0 |
||||||||||||
| Commentary: Almost all students answered questions 1, 2 and 3 correctly, but only 45 percent combined information to answer question 4 correcttly. |
|||||||||||||


