|
||||||||||
|
||||||||
Questions/instructions:
|
||||||||
| %
responses |
||||||||
| 1.
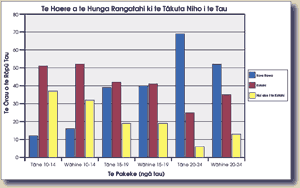
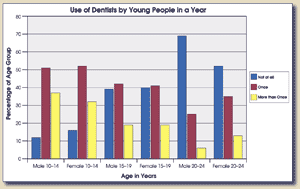
He aha te körero e whakaaturia ana ki te kauwhata mö te maha
o ngä haere a te tangata ki te täkuta niho ina pakeke haere
ia? What does the graph show about the number of visits to the dentist as people get older? |
people
go less often as they get older |
7 |
||||||
| 2.
Ko tëhea te röpü he tino iti ä rätou haere ki
te täkuta niho? Which group of people have the smallest number of visits to the dentist? |
males
20-24 years old |
52 |
||||||
| 3.
He aha te örau o te hunga tamatäne i waenganui i te 10 me te
14 tau te pakeke, kotahi anake te wä i ia tau ka haere ki te täkuta
niho? What percentage of males aged 10–14 go to the dentist once a year? |
51–52%
|
24 |
||||||
| 4.
He aha ëtahi körero e toru e whakaaturia ana ki te kauwhata,
mö te hunga kötiro i waenganui i te 10 me te 14 te pakeke? What are three things this graph tells about dentist visits by females aged 10–14? |
3
points made |
0 |
||||||
2
points made |
9 |
|||||||
1
point made |
11 |
|||||||
Total
score: |
6
|
0 |
||||||
4–5
|
4 |
|||||||
2–3
|
29 |
|||||||
0–1
|
67 |
|||||||
| Commentary: Most students struggled to extract information from this complex graph. |
||||||||

