|
||||||||||
|
|||||||||||
Questions/instructions:
|
|||||||||||
| %
responses
|
|||||||||||
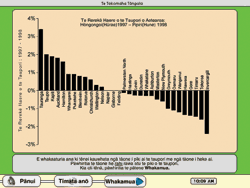
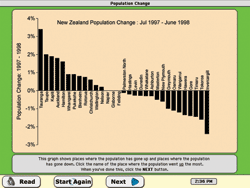
E whakaaturia ana ki tënei kauwhata ngä täone i piki ai taupori me ngä täone i heke ai. This graph shows places where the population has gone up and places where the population has gone down. |
|||||||||||
| Päwhiritia
te täone he rahi rawa atu te piki o te taupori. Click the name of the place where the population went up the most. |
Tauranga
|
72 |
|||||||||
| Päwhiritia
te täone he rahi rawa atu te heke o te taupori. Click the name of the place where the population went down the most. |
Invercargill |
51 |
|||||||||
| Päwhiritia
ngä täone karekau i rerekë te taupori, ka pümau tonu. Click the names of the places where the population has not changed. |
Napier,
Gisborne, Feilding |
28 |
|||||||||
| E
hia örau te pikinga ake o te taupori o Taupo? Tuhia tö whakautu
ki te pouaka köwhai. By how much did Taupo’s population go up? Type your answer into the yellow box. |
2%
|
79 |
|||||||||
Total
score: |
4 |
19 |
|||||||||
3
|
30 |
||||||||||
2
|
21 |
||||||||||
1
|
21 |
||||||||||
0
|
9 |
||||||||||
| Commentary: About half of the students got at least three of the four components correct. |
|||||||||||

