|
|||||||||||||||||
|
|||||||||||||||||
%
responses 2009 ('05) |
|||||||||||||||||
y4 |
y8 |
||||||||||||||||
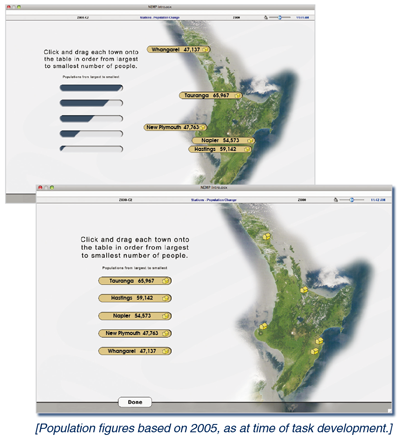
| Ordered as: | 1st | Tauranga 65,967 | 87 (80) | 98 (95) | |||||||||||||
| 2nd | Hastings 59,142 | 86 (69) | 96 (93) | ||||||||||||||
| 3rd | Napier 54,573 | 81 (86) | 96 (97) | ||||||||||||||
| 4th | New Plymouth 47,763 | 83 (69) | 96 (94) | ||||||||||||||
| 5th | Whangarei 47,137 | 80 (75) | 95 (94) | ||||||||||||||
| [Population
figures based on 2005, as at time of task development.] |
|||||||||||||||||
Total
score: |
5 | 76 (64) | 94 (92) | ||||||||||||||
| 3–4 | 7 (12) | 2 (2) | |||||||||||||||
| 2 | 3 (3) | 1 (1) | |||||||||||||||
| 1
|
10 (17) | 2 (4) | |||||||||||||||
| 0 | 4 (4) | 1
(1) |
|||||||||||||||
| Subgroup Analysis [Click on charts to enlarge] : |
Year 4 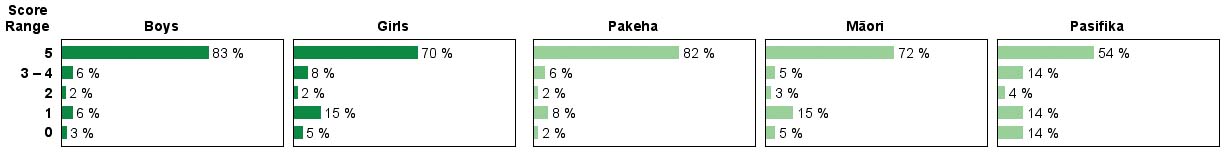 |
||
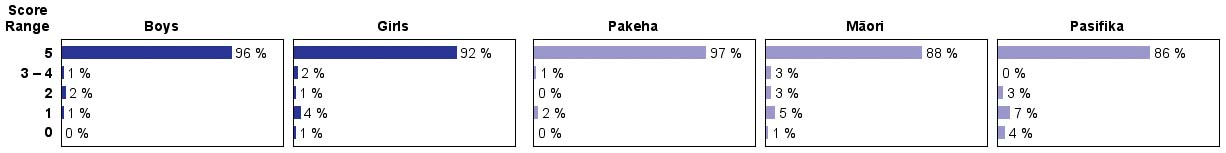
| Commentary: |
| Placing
the five towns in order by size proved easy for most students. Between
2005 and 2009 the performance of year 4 students improved a little, with
no meaningful change for year 8 students. Year 4 boys scored significantly
higher than year 4 girls. |