| Approach: |
Station |
|
Level: Year
4 |
| Focus: |
Tallying
and interpreting data |
|
| Resources:
|
Computer
program on laptop computer, answer booklet |
|
|
| Questions/instructions: |
|
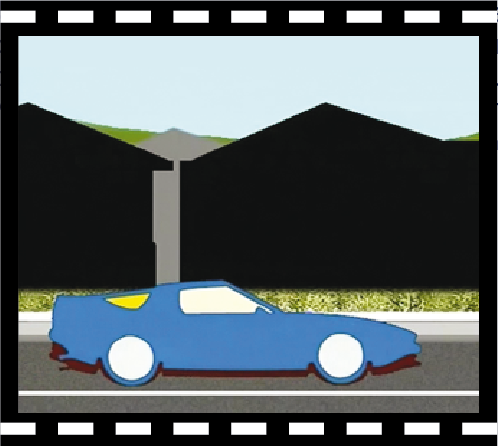
This
activity uses the computer.
[Simple animation with cars passing through screen one at
a time, each taking five seconds to pass through.]
|
 |
| |
voiceover instructions:
You have been asked to make a tally chart that shows the number of
different coloured cars that pass your school gate. Use the chart
in your answer book to keep a tally of how many cars pass your
school. Do not try to do any of the other questions while you are
filling in the tally chart. You will have time to do these later.
Click the start button to begin. |
| |
| |
|
|
| |
%
responses
2009 ('05) |
y4 |
y8 |
| 1.
Tally Chart |
|
|
|
| Red Cars |
White Cars |
Yellow Cars |
Blue Cars |
Other Colours |
  |
 |
 |
|
|
|
|
|
| Tally
method: |
conventional
groups of 5 |
68
(51) |
| |
sticks
only |
20
(31) |
| Tally for: |
Red
cars – 6 |
81
(74) |
| |
White
cars – 8 |
78
(69) |
| |
Yellow
cars – 4 |
79
(77) |
| |
Blue
cars – 5 |
83
(76) |
| |
Other
cars – 3 |
84
(76) |
| 2.
How many blue cars went past the school? |
5
|
81
(74) |
| 3.
Which colour car was the most common? |
white
|
82
(76) |
| 4.
How many cars went past the school altogether? |
26
|
60
(55) |
| 5.
Which colour car is most likely to come next? |
not
marked |
• (•) |
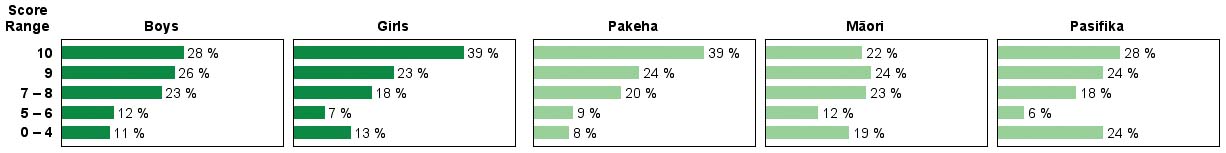
|
Total
score: |
10
|
34
(24) |
|
9
|
24
(26) |
7–8
|
21
(16) |
5–6
|
9
(13) |
| 0–4
|
12
(21) |