The graphs and figures that illustrate the derivation of a hierarchical
cluster profile based on the equivalents C Sample task follow.
The initial cluster solution is illustrated below in Figure 42 shaded
at the 6cluster solution.

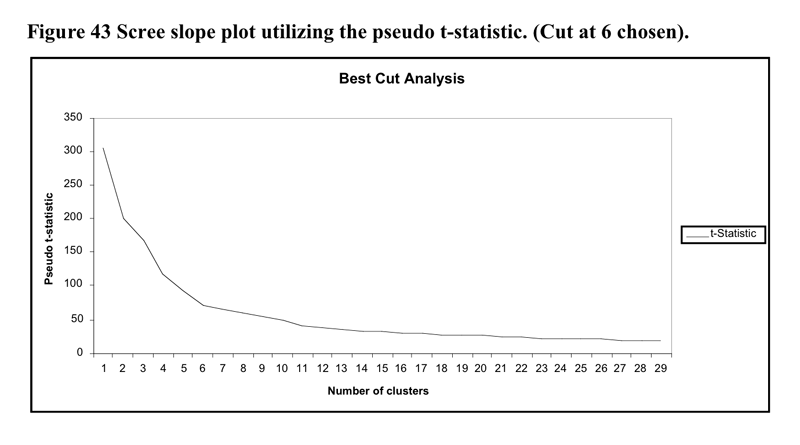
The heirarchical cluster solution was based upon the flexible cluster procedure with beta set to -.25. The 22 cases were removed from the analysis as they became irreconcilable single case clusters made up of missing data. The scree slope of the pseudo t statistic which led to the decision to utilise the six cluster solution is illustrated in Figure 43 below. The flattening out of the pseudo-t line past the 6 cluster point may be because the amalgamations between clusters past that point do not represent joinings between profoundly different clusters.
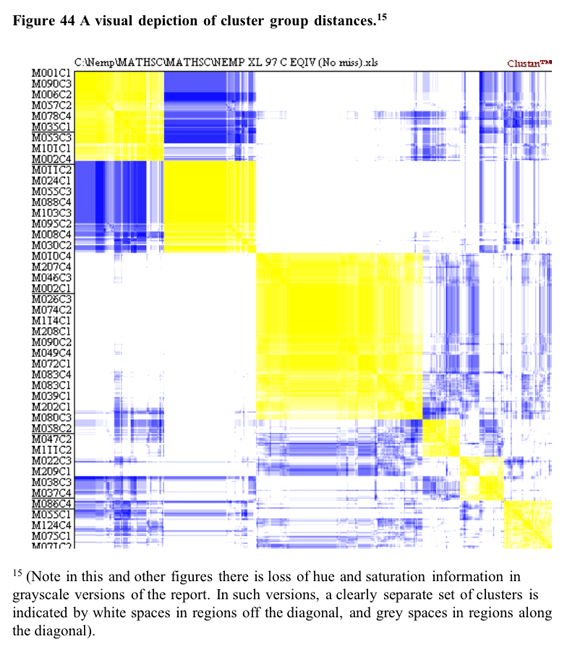
Some support for the
five cluster solution is found in the visual depiction of cluster solutions
in Figure 44 below. Coloured versions of the figure showed that in general
there tended to be a higher colour density within clusters than between
clusters. This is particularly evident in the low proximities between
all cluster except for clusters (1 and 2) [14].
The relatively large separating differences of the upper shaded branches
branches of the dendogram in Figure 42 (assessed from the distance moved
along the horizontal axis) also suggests distinct clusters.
[14] Note that low proximities between clusters are necessary but not sufficient conditions for “real” clusters. To be regarded as such, there must also be close proximities within clusters.
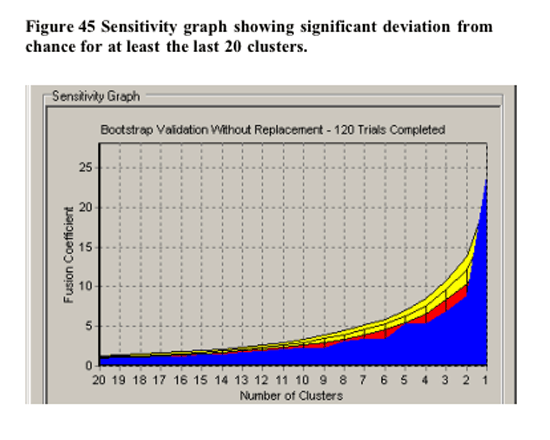
In terms of validation of the non-randomness of the cluster solution at 5 clusters, CLUSTAN GRAPHICS allowed the comparison of the series of fusion coefficients (distances) of the actual sample compared to a series of Bootstrap-derived samples. The results of this comparison is detailed in Figure 45 below. The largest deviations of the Bootstrap derived samples from the other samples between 4 and 6 clusters. . Based upon these results, the decision to utilise the 6 cluster solution in further analysis has justification.
Qualitative
Summary of cluster groups![]() Cross
tabulation of each task by the three cluster groups was carried out.
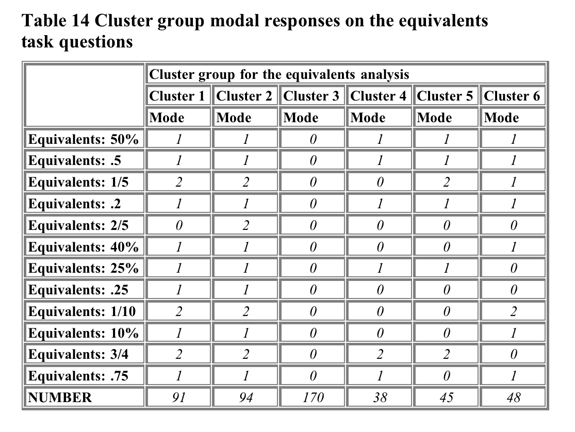
Table 14 shows the modal responses of the cluster groups on the task
questions.
Cross
tabulation of each task by the three cluster groups was carried out.
Table 14 shows the modal responses of the cluster groups on the task
questions.
The
crosstabulation summary is to be found in Appendix XV. For most questions
there was a significant chi-square statistic indicating non-chance differences
in the distributions of task responses between groups. A qualitative
summary of the cluster group profiles obtained by the cross tabulation
of each Nemp task question by cluster group follows:
Cluster groups 1 and 2 showed good performance on most items.
We might label this combined group the equivalents competent cluster
group.
Cluster group 3 showed poor performance on all equivalents task
questions. We might label this group the equivalents difficulties
cluster group.
Cluster group 4 showed relative difficulty with the items requiring
production of fractional equivalents. We might label this group the
fractional equivalents difficulties cluster group.
Cluster group 5 showed relative difficulty with the items requiring
movement to other representations from fractional equivalents. We might
label this group the difficulty in production with non fractional
equivalents cluster group.
Cluster group 6 showed relative difficulty with the items involving
quartile equivalents. We might label this group the quartile equivalents
difficulties cluster group.
Global summary
The six cluster group solution indicates that 38% of the sample show
good all around competence, and 35% of the sample show extreme difficulties
with obtaining equivalent symbolic representation of fractional number.
The remaining 27% of the sample show particular difficulties that might
have specific teaching strategies developed to address.
The groups emerging from the analysis of the sample C cluster equivalents
task bears some similarity to the groups emerging from the A sample
0-1 number line task. Thus, there is some cross-validation of the distinguishing
features of the cluster groups obtained from number representation tasks
in the two analyses.
An important question is that of the extent to which cluster solutions "correlate" with each other. To answer that, cross-tabulation tables for the cluster groups obtained from different tasks were generated. The Chi Square values and contingency coefficients are provided in Table 15 and Table 16. It can be seen that the cross section task cluster solution has a moderate level of association with the cut cube task cluster solution and the equivalents task cluster solution.


There are some intriguing
results evident in the Tables in Appendix XVI. The general picture though
is that where there is a significant association - those cluster groups
working at a deeper mathematical level on one task are likely to be well
represented amongst the cluster groups working at a deeper level on another.
Since the non-significant association was between two geometry tasks,
it is not possible to claim that there is evidence for a specific space-related
psychological structure running across tasks [16].
[16]
Note the current findings do not provide evidence against that proposition.
The cut cube Cluster group structure did not receive strong validation
support and that may be the reason for the lack of contingency.
Previous
sections have summarised the main findings associated with a particular
analysis. This section draws the findings together in a brief synopsis
of what has emerged in the eight cluster analyses of this probe study.
I. Clusters of excellence and uncertainty
The analysed results indicate that there are groups of students which
we can say are "similar" in their profiles across tasks. Some
of these clusters have profiles which indicate that they are succeeding
in the mathematics taught in the New Zealand curriculum. Some clusters
have members who are similar in their particular difficulties. Unfortunately,
there is also a sizeable proportion of students who are not able to do
a considerable number of the NEMP tasks. In the case of the latter students,
they are not defined by the mathematical tasks that they cannot do, but
rather by the few mathematical tasks that they can do. Approximately 20%
of students within these clusters have difficulties of such a magnitude
that they are operating at barely Level 2 of the New Zealand Mathematics
Curriculum. (Year 8 students are expected to be operating at about Level
4 of the Achievement objectives of the Curriculum).
II. Uncovering microgenesis of task difficulties
Particularly when cluster analysis was applied to the multiple questions
associated with one task, there was evidence that students could have
a range of difficulties within the same task. An example that illustrated
this very clearly was the analysis of the task of placing values between
0 and 1 on a number line with the range 0 to 1. Students fell "naturally"
into cluster groupings of a) those most familiar with fractional representation
of such quantities b) those most familiar with decimal representation
of such quantities and c) those most familiar with percentage representation
of such quantities.
Other indicative results included:
- There was a distinct cluster group that appeared to have particular difficulty with the algebra of inverse operations.
- Distinct cluster groups that appeared to have difficulty with algebra in non-contextualised situations requiring abstract (symbolic) formulations.
- Distinct cluster groups having difficulty with equivalents between fractional, decimal and percentage expressions of number.
- Distinct cluster groups of those capable of mentally obtaining the geometrical forms of imaginary cuts through familiar objects such as potatos, some were able to carry out more sophisticated cross-sections than others.
III. Relationships
exist between emergent clusters based upon different tasks
Examination of the emergent clusters in particular tasks revealed that
being in a more able cluster group on one task, was a good predictor of
being in a more able cluster group on an apparently unrelated task (e.g.
number equivalents and geometry of cross-sections). This is in line with
the indication that some clusters had global difficulties emerging from
the cluster analyses of the variables in the whole task set. This in turn
is consistent with there being metacognitive and demographic background
factors that play a part in the development of mathematical knowledge.
IV. Metacognitive and attitudinal influences in mathematical development
There was good evidence from the cluster analysis carried out on Sample
A that the meaning of mathematics learning was different between students
of different clusters. Amongst students in poorly performing clusters,
there tended to be a higher emphasis on the value of knowing mathematical
facts, and on the doing of teacher set worksheets or working in their
books. Although the students in other clusters also emphasized these devices,
they were more likely to suggest problem-solving as influential in learning
(and indeed, what they enjoyed about mathematics).
V. Demographic factors in mathematics development
There was no evidence of gender differences being important in this study.
However, what appeared as an important influence was ethnicity, with Mäori
students being less likely to be included amongst the clusters of students
doing well in mathematics. The ethnicity factor is strongly correlated
with the socioeconomic status of the student and thus the student being
in a low school decile was a very strong predictor of membership in those
clusters experiencing difficulties in mathematics. The question must be
raised about how successful the Targeted Funding for Educational Achievement
has been in meeting the mathematical education needs of students attending
low decile schools.
VI. Cluster analysis offers possibilities for data mining the
NEMP data
The study has shown that Cluster Analysis can be a very useful tool for
mining large datasets of NEMP data. Rather than starting from particular
hypotheses and deductively interrogating the database, the procedure of
this study has been one of statistical induction. Such an approach allows
the scan of large amounts of data and the identification of emergent clusters
which can be thought of as hilltops that overlook an undulating landscape.
These hilltops are somewhat shrouded in mist so further validation of
the clusters emerging in studies such as these will be necessary.
For Educators:
![]() There
are a number of educational implications which can be drawn from the study.
I draw attention to the importance of the following:
There
are a number of educational implications which can be drawn from the study.
I draw attention to the importance of the following:
I. There is a need for mathematics education that will move students
forward beyond algorithms and mathematical facts.
Most of the students in poorly performing cluster groups showed a good
level of performance at number facts and a moderate level of performance
at algorithms (subtraction is an exception). However, in problem-solving
tasks involving more than procedural knowledge these students performed
very poorly. Clearly the scope of mathematics education for students experiencing
difficulties needs to be expanded - beyond the recall of "the basics"
to being able to develop their own "mathematical intelligence".
II. Utilise the NEMP tasks and other tasks when planning for groups
of students.
The NEMP tasks along with the emergent cluster groups highlight the need
for teachers to develop strategies for dealing with the learning needs
of students in the developmental bands between achievement levels. What
the particular strategies should be is beyond the scope of this study
however knowledge of the cluster groups likely to be represented in the
classroom is an important first step in planning learning experiences.
Information from this probe study and other studies such as those of McIntosh
(2002) or Fuson, Wearne, Hiebert Human, Murray, Oliver, Carpenter, &
Fennema (1997) can be utilised in the planning process.
III. Foster metacognitive development in the mathematics classroom.
More so than other students, poorly performing students appear to regard
mathematics as a drill and practice, "ask the teacher first",
pencil and paper tasks. There are many good open-ended, open-middle, even
open-beginning mathematical experiences available to mathematics educators
that can help change that view. (c.f. Ritchie, 1991)
IV. More effective interventions must be found for mathematics
education in low decile schools.
The question must be raised about how successful the Targeted Funding
for Educational Achievement has been in meeting the mathematics education
needs of students attending low decile schools? A fuller analysis would
be required to find solutions here, but clearly the TFEA funding still
leaves students attending these schools well behind other students in
mathematics achievement. Perhaps specific allocation of some of the funding
provided for Mäori and Pacific Island family mathematics programmes might
be worth investigating.
For
Education Researchers
![]()
I. The Cluster Analysis of the current study should be validated further
This study has a number of methodological limitations. Two of them result
from the the lack of time to carry out further validation of cluster solutions:
- The extent of internal validation was limited to assessment of the null model utilising bootstrapping. (There was no attempt to validate the partition obtained by withholding a part of the sample and looking for replication of the cluster structure in a rerunning of the cluster analysis including the withheld sample.)
- The extent of relative validation was restricted to that of examining the Scree slope for the best partition of the flexible cluster model. There was no attempt to compare with alternative cluster models. Neither was there utilisation of the approach of generating a discriminant function on external variables ; utilising it on the withheld sample; comparing the cluster assignment of the discriminant function with that obtained in various cluster analyses of the withheld sample (on the original variables).
A further specific
limitation was the related to the approach to deal with cluster analysis
of binary and nominal data. For NEMP sample A, the approach was to develop
binary categories of all variables. While this did achieve a good structure,
it lowered proximities between clusters (and within clusters), and also
resulted in a differential weighting of variables with more categories.
(The alternative usual approach of distances being 1 unless the cases
are in the same "state" in the nominal variables it might be
argued overweights binary variables.)
Unfortunately given the scope of this project the effects of different
distances, different metrics, and indeed different clustering methods
have not been explored. If cluster analysis is to be used on other NEMP
data sets, some of these questions could be looked at in depth.
II. The Cluster analysis of the current study should be extended
Very simply the following analyses remain to be carried out:
- Any Cluster analysis of the 1997 NEMP mathematics data.
- Any Cluster analysis of the 2001 NEMP mathematics year 4 student sample.
- Cluster analysis of the full set of tasks of NEMP mathematics sample A.
- Cluster analysis of most of the individual tasks in NEMP mathematics sample A, B, C.
- Cluster analysis of the tasks across individuals also remains a possible exploratory device.
III. Cluster
analysis should be used to data mine other NEMP databases
The study has shown that Cluster Analysis can be a very useful tool for
mining large datasets of NEMP data. If in the opinion of the NEMP project
and the Ministry of Education such Cluster analysis based data mining
is of value in exploring NEMP mathematics tasks, then Cluster analysis
can be used to investigate Art, English, Science, or any other NEMP database.


