|
|
||||||||||||||||||||||||||||||||||||
| Reading
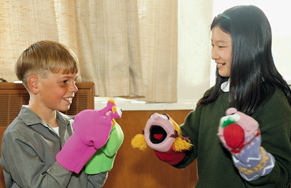
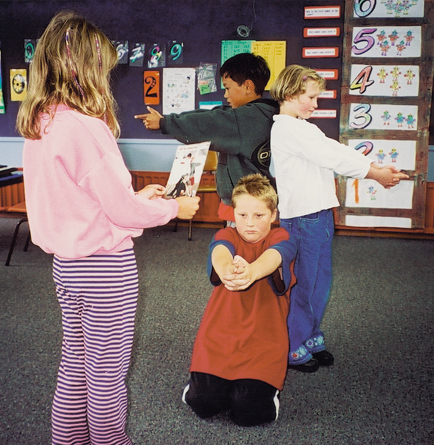
and Speaking Surveys The national monitoring reading and speaking surveys sought information from students about their curriculum preferences and their perceptions of their achievement. Students were also asked about their enjoyment of and involvement in reading and speaking activities, within school and beyond. The surveys were administered in a session which included group and independent tasks, with a teacher reading the survey to year 4 students and available to help with writing. There were four questions that invited students to select up to three choices from lists of 8 to 10 options, two questions that asked for very brief written responses, and 21 questions in a 4 or 5 option rating format, with students circling the option they preferred. |
||||||||||||||||||||||||||||||||||||
The students were presented with a list of eight reading activities and asked which they liked doing most at school. They were invited to tick up to three activities. The responses are shown adjacent, in order of popularity for year 4 students. However, year 8 students expressed stronger preferences than year 4 students for silent reading and browsing through books, together with weaker preferences for reading with a partner or reading with the teacher. The two most popular categories declined a little in popularity between 1996 and 2000, with little change on the other six categories. |
|
|||||||||||||||||||||||||||||||||||
The results show that year 4 students tend to think about reading as a technical task, requiring learning hard words and listening to the teacher, whereas year 8 students place greater emphasis on enjoying reading, reading a lot, and choosing the right book. This difference has increased between 1996 and 2000. |
|
|||||||||||||||||||||||||||||||||||
In response to a list of seven types of reading material, students indicated up to three which they liked reading in their own time. The responses are shown (right), in order of popularity for year 4 students. The results reveal some important changes of voluntary reading activity between year 4 and year 8. In particular, year 8 students reported a considerably greater focus on reading magazines, and markedly less interest in comics and poetry. Between 1996 and 2000, fiction has become more popular for year 8 students, non-fiction substantially less popular for year 4 students, and newspapers less popular for year 8 students. |
|
|||||||||||||||||||||||||||||||||||
The students were presented with a list of nine activities that they might do in their spare time, and asked to tick up to three activities that they most liked to do. The responses are shown (right), in order of popularity for year 4 students: The notable differences between year 4 and year 8 responses are the markedly lower interest of year 8 students in "doing art", and their higher interest in activities with others (playing with friends, playing games or sports, talking on the telephone with friends) and doing musical things. |
|
|||||||||||||||||||||||||||||||||||
|
|
||||||||||||||||||||||||||||||||||||
|
Students were also asked "Which language do you mainly speak at home?".The responses were placed in categories and percentages are tabulated (right).
|
|
|||||||||||||||||||||||||||||||||||
Responses to the 21 rating items are presented in separate tables for year 4 students and year 8 students (below). |
||||||||||||||||||||||||||||||||||||
 The national monitoring assessment programme recognises the impact of
attitudinal and motivational factors on student achievement in individual
assessment tasks. Students' attitudes, interests and liking for a subject
have a strong bearing on progress and learning outcomes. Students are
influenced and shaped by the quality and style of curriculum delivery,
the choice of content and the suitability of resources. Other important
factors influencing students' achievements are the expectations and
support of significant people in their lives, the opportunities and
experiences they have in and out of school, and the extent to which
they have feelings of personal success and capability.
The national monitoring assessment programme recognises the impact of
attitudinal and motivational factors on student achievement in individual
assessment tasks. Students' attitudes, interests and liking for a subject
have a strong bearing on progress and learning outcomes. Students are
influenced and shaped by the quality and style of curriculum delivery,
the choice of content and the suitability of resources. Other important
factors influencing students' achievements are the expectations and
support of significant people in their lives, the opportunities and
experiences they have in and out of school, and the extent to which
they have feelings of personal success and capability. | YEAR 4 READING AND SPEAKING SURVEY |
%
responses 2000 (1996) |
|||||
| don't know | ||||||
| 1. How much do you like reading at school? | 52 (50) | 33 (40) | 7 (8) | 8 (2) | ||
| 2. How good are you at reading? | 50 (32) | 39 (56) | 9 (11) | 2 (1) | ||
| 3. How good does your teacher think you are at reading? | 42 (33) | 27 (23) | 4 (7) | 3 (0) | 24 (37) | |
| 4. How good does your Mum or Dad think you are at reading? | 70 (62) | 17 (22) | 3 (3) | 1 (1) | 9 (12) | |
| heaps | quite
a lot |
some tmes |
never | |||
| 5. Does your teacher tell you what you are good at in reading? | 14 | 27 | 50 | 9 | ||
| 6. Does your teacher tell you what you need to improve at in reading? | 13 | 16 | 50 | 21 | ||
| 7. How often do you read to others at school? | 14 | 21 | 51 | 14 | ||
| 8. How much do you like reading in your own time - not at school? | 60 (56) | 24 (29) | 9 (10) | 7 (5) | ||
| 9. How do you feel about getting a book for a present? | 63 (75) | 27 (19) | 7 (3) | 3 (3) | ||
| 10. How do you feel about looking at books in a bookshop? | 62 (68) | 27 (23) | 8 (6) | 3 (3) | ||
| 11. How do you feel about going to a library? | 74 (72) | 20 (21) | 4 (5) | 2 (2) | ||
| 12. How do you feel about the stories/books you read as part of your reading programme at school? | 46 (47) | 40 (40) | 9 (9) | 5 (4) | ||
| 13. How do you feel when your teacher reads a story out loud? | 66 (78) | 21 (16) | 7 (3) | 6 (3) | ||
| 14. How do you feel about how well you read? | 63 (53) | 27 (38) | 7 (7) | 3 (2) | ||
| 15. How do you feel about reading in a group in the classroom? | 41 (43) | 35 (38) | 15 (12) | 9 (7) | ||
| 16. How do you feel when you are asked to read out loud to the teacher? | 32 (36) | 34 (34) | 16 (16) | 18 (14) | ||
| 17. How do you feel when asked to read out loud to the class? | 28 (26) | 25 (26) | 19 (20) | 28 (28) | ||
| 18. How much do you like talking to your whole class? | 38 (32) | 35 (39) | 16 (17) | 11 (12) | ||
| 19. How much do you like talking to a group in your class? | 49 (57) | 33 (29) | 12 (11) | 6 (3) | ||
| heaps | quite
a lot |
some times |
never | |||
| 20. How often do you get to talk to your whole class? | 12 (10) | 19 (25) | 58 (61) | 11 (4) | ||
| 21. How often do you get to talk to others in your class? | 35 (45) | 33 (31) | 30 (22) | 2 (2) | ||
| YEAR 8 READING AND SPEAKING SURVEY |
%
responses 2000 (1996) |
|||||
| don't know | ||||||
| 1. How much do you like reading at school? | 32 (31) | 50 (55) | 13 (12) | 5 (2) | ||
| 2. How good are you at reading? | 31 (18) | 53 (56) | 14 (23) | 2 (3) | ||
| 3. How good does your teacher think you are at reading? | 24 (10) | 26 (27) | 7 (8) | 2 (1) | 41 (54) | |
| 4. How good does your Mum or Dad think you are at reading? | 45 (27) | 27 (35) | 8 (9) | 3 (2) | 17 (27) | |
| heaps | quite a lot |
some tmes |
never | |||
| 5. Does your teacher tell you what you are good at in reading? | 6 | 15 | 58 | 21 | ||
| 6. Does your teacher tell you what you need to improve at in reading? | 9 | 16 | 50 | 25 | ||
| 7. How often do you read to others at school? | 3 | 15 | 59 | 23 | ||
| 8. How much do you like reading in your own time - not at school? | 36 (39) | 36 (38) | 18 (18) | 10 (5) | ||
| 9. How do you feel about getting a book for a present? | 35 (45) | 37 (39) | 22 (13) | 6 (3) | ||
| 10. How do you feel about looking at books in a bookshop? | 42 (52) | 41 (37) | 14 (9) | 3 (2) | ||
| 11. How do you feel about going to a library? | 42 (53) | 38 932) | 14 (12) | 5 (3) | ||
| 12. How do you feel about the stories/books you read as part of your reading programme at school? | 25 (24) | 42 (52) | 23 (18) | 10 (6) | ||
| 13. How do you feel when your teacher reads a story out loud? | 42 (51) | 37 (36) | 15 (10) | 6 (3) | ||
| 14. How do you feel about how well you read? | 43 (30) | 41 (49) | 12 (18) | 4 (3) | ||
| 15. How do you feel about reading in a group in the classroom? | 24 (26) | 39 (41) | 28 (24) | 9 (9) | ||
| 16. How do you feel when you are asked to read out loud to the teacher? | 20 (19) | 37 (36) | 26 (25) | 17 (20) | ||
| 17. How do you feel when asked to read out loud to the class? | 15 (13) | 30 (25) | 24 (23) | 31 (39) | ||
| 18. How much do you like talking to your whole class? | 24 (17) | 37 (41) | 26 (28) | 13 (14) | ||
| 19. How much do you like talking to a group in your class? | 46 (51) | 38 (39) | 13 (8) | 3 (2) | ||
| heaps | quite
a lot |
some tmes |
never | |||
| 20. How often do you get to talk to your whole class? | 7 (3) | 25 (30) | 62 (65) | 6 (2) | ||
| 21. How often do you get to talk to others in your class? | 40 (50) | 40 (37) | 19 (12) | 1 (1) | ||
|
Some interesting positive features were present in the responses of both year 4 and year 8 students:
Less positive features common to year 4 and 8 students were:
Looking at the most positive and least positive categories, there were some noteworthy changes from 1996 to 2000:
|
 There
were substantial differences between year 4 and year 8 students on some
questions. Our experience with previous NEMP surveys (in all subjects)
has shown that year 8 students are less inclined than year 4 students
to use the most positive rating category. The comparisons used here
are based on the percentages in the top two and the bottom categories.
Differences of 10 percent or more between year 4 and year 8 responses
were:
There
were substantial differences between year 4 and year 8 students on some
questions. Our experience with previous NEMP surveys (in all subjects)
has shown that year 8 students are less inclined than year 4 students
to use the most positive rating category. The comparisons used here
are based on the percentages in the top two and the bottom categories.
Differences of 10 percent or more between year 4 and year 8 responses
were: