|
||||||||||||||||
|
||||||||||||||||
%
responses 2007 ('03) |
||||||||||||||||
y4 |
y8 |
|||||||||||||||
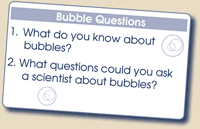
| Proportion of questions which could lead to useful knowledge about the science associated with bubbles: |
all or almost all |
44 (41) |
44 (55) |
|||||||||||||
more than half (60-80%) |
39 (35) |
37 (28) |
||||||||||||||
about half |
7 (14) |
7 (5) |
||||||||||||||
less than half (20-40%) |
7 (7) |
11 (12) |
||||||||||||||
none or almost none |
3 (3) |
1 (0) |
||||||||||||||
| Proportion of questions with blue
dots which could reasonably be
answered by children doing experiments: |
all or almost all |
6 (5) |
15 (10) |
|||||||||||||
more than half (60-80%) |
13 (19) |
22 (22) |
||||||||||||||
about half |
15 (12) |
16 (11) |
||||||||||||||
less than half (20-40%) |
33 (20) |
24 (24) |
||||||||||||||
none or almost none |
33 (44) |
23 (33) |
||||||||||||||
| Proportion of questions with red dots which could not reasonably be answered by children doing experiments: |
all or almost all |
37 (58) |
52 (57) |
|||||||||||||
more than half (60-80%) |
16 (25) |
24 (23) |
||||||||||||||
about half |
15 (3) |
10 (7) |
||||||||||||||
less than half (20-40%) |
16 (9) |
9 (10) |
||||||||||||||
none or almost none |
16 (5) |
5 (3) |
||||||||||||||
| Proportion of questions with red dots
which could best be answered by
appropriately qualified scientists: |
all or almost all |
15 (22) |
26 (30) |
|||||||||||||
more than half (60-80%) |
18 (24) |
31 (28) |
||||||||||||||
about half |
21 (10) |
14 (10) |
||||||||||||||
less than half (20-40%) |
28 (27) |
21 (24) |
||||||||||||||
none or almost none |
18 (17) |
8 (8) |
||||||||||||||
| Number of questions listed: |
8 or more |
50 (68) |
65 (67) |
|||||||||||||
6 or 7 |
31 (27) |
26 (25) |
||||||||||||||
4 or 5 |
17 (5) |
7 (6) |
||||||||||||||
less than 4 |
2 (0) |
2 (2) |
||||||||||||||
Total
score: |
17–19 |
1 (5) |
13 (13) |
|||||||||||||
15–16 |
11 (17) |
25 (22) |
||||||||||||||
12–14 |
32 (39) |
31 (33) |
||||||||||||||
9–11 |
34 (24) |
21 (25) |
||||||||||||||
0–8 |
22 (15) |
10 (7) |
||||||||||||||
| Commentary: |
| Because this is a team task, no graph of subgroup performance is possible. There was little change in performance between 2003 and 2007 for year 8 students, but a marked decline for year 4 students. |
 Preparation: Put a small amount of bubble mixture
and a straw into each jar.