|
:
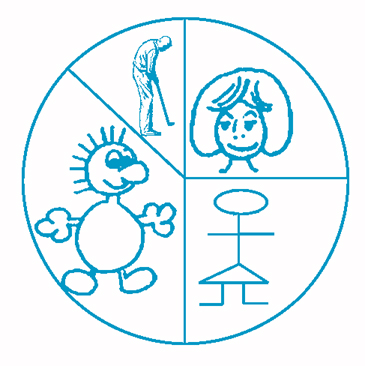
Family Pictures
|
|
||||
|
Questions / instructions:
|
||||
| % responses | ||||
|
y4
|
y8
|
|||
|
1. Which pile of pictures was the largest? cartoon figures |
90
|
97
|
||
|
2. 5 children drew heads only. How many children drew stick figures? 5 |
28
|
69
|
||
| Commentary: Question 2 required students to identify that the two relevant sectors were the same size, so that the number of drawings was the same for these two sectors. Year 4 students were much less able to do this than year 8 students. |
||||