|
:
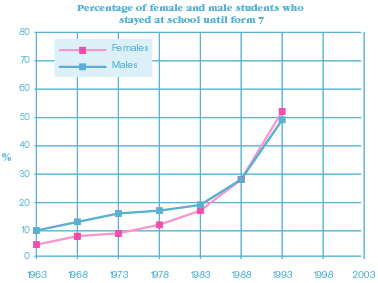
Staying on at School
|
|
||||
|
Questions / instructions: Presented orally. This graph shows the percentage of
female and male students who stayed at school until Form 7.
|
||||
| % responses | ||||
|
y8
|
||||
|
1. In 1993, did a higher percentage of female or a higher percentage of male students stay at school for form 7? female higher |
70
|
|||
|
2. Tell me 3 other things this graph shows. Eg
large increase since 1983, 3 |
36
34 |
|||
|
3. Draw on the graph what you think will happen in 1998. Why do you think that will happen? Marked
for consistency between what was |
26
|
|||
[ top of the page | Graphs, Tables and Maps Report 1995 ]