|
:
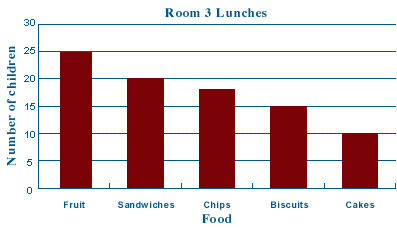
What's for Lunch
|
|
||||
|
Questions / instructions:
|
||||
| % responses | ||||
|
y4
|
y8
|
|||
|
1. What food did most children have? Fruit |
90
|
99
|
||
|
2. How many children had biscuits for lunch? 15 |
63
|
98
|
||
|
3.
More children had sandwiches
than cakes. 10 |
27
|
73
|
||
|
Commentary: |
||||
[ top of the page | Graphs, Tables and Maps Report 1995 ]