|
:
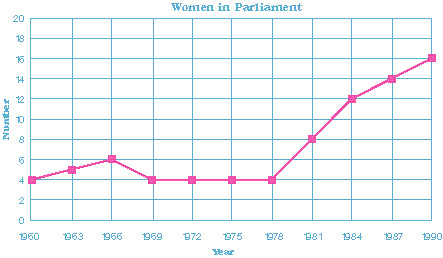
Women in Parliament
|
|
||||
|
Questions / instructions:
|
||||
| % responses | ||||
|
y8
|
||||
|
1. How many women were in parliament in 1975? 4 |
97
|
|||
|
2. When did the number of women in parliament start to increase most quickly? 1978 or 1981 |
59
|
|||
|
3. Write down one other important thing the graph tells about women in parliament. Eg
4x as many women in 1990 than 1978; |
27
|
|||
|
Commentary: Question 3 proved particularly demanding. Many answers were quite vague; others focused on details that were much less important than the major trends. |
||||
[ top of the page | Graphs, Tables and Maps Report 1995 ]