|
|
:
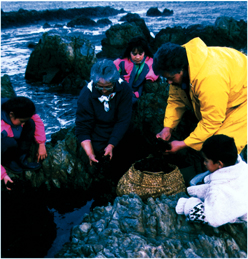
Ani's Place |
|
| 1. Tally marks have been made for sea eggs and for mussels. Make the tally marks for the other sea foods. | |||
|
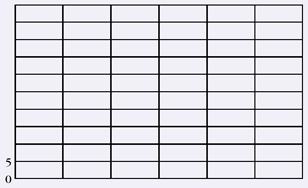
2. Show the
information on a bar graph.
|
|
||
 |
correct
bar height: sea eggs
|
35
|
73
|
|
mussels
|
49
|
88
|
|
|
crayfish
|
38
|
80
|
|
|
crabs
|
47
|
88
|
|
|
paua
|
47
|
88
|
|
|
octopus
|
37
|
78
|
|
| 3. Write a name for your graph in the best place. |
suitable
title given
|
21
|
53
|
|
title above graph
|
56
|
78
|
|
| 4. Write a label on the vertical side or left side of the graph. |
Y
axis: title & value labels
|
14
|
54
|
|
value
labels only
|
49
|
40
|
|
| 5. Write a label on the horizontal line or bottom of the graph. |
X
axis: appropriate title
|
19
|
64
|
| Commentary: Both year 4 and year 8 students used tally marks well, but were much less successful in providing labels for their graph and its areas. On average, about 35 percent more year 8 than year 4 students were successful with the required components of the bar graph. |
|||
|
|
||
|
|
||
