|
|
|
|||||
| |
|||||||
| Focus: Interpreting a pie graph. | |||||||
|
|||||||
|
Questions / instructions: |
|||||||
|
%
responses
|
|||||||
|
y4
1999(1995) |
y8
1999(1995) |
||||||
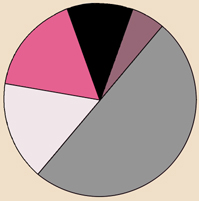 |
1. How does Tim use most of his money? |
savings
|
77(77)
|
91(92)
|
|||
| 2. What does he spend the least amount on? |
magazines
|
92(92)
|
99(99)
|
||||
| 3. What items does he spend the same amount on? |
clothes
& food
|
84(83)
|
96(97)
|
||||
| 4. If Tim spent all of his clothes money on food, would he spend more on food or on savings? |
savings
|
83(78)
|
88(92)
|
||||
|
Total
score: 4
3 0–2 |
60(54)
24(30) 16(16) |
81(82)
14(16) 5(2) |
|||||
| Commentary: For the year 4 and year 8 students, there was little change over the four years in their ability to interpret this pie graph. About 10 percent more year 4 than year 8 students had little success with this task in 1999. |
|||||||
|
|
||