|
|
:
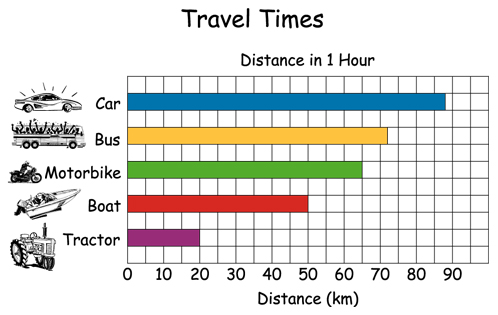
Travel Times |
|
|
|||||
| Focus: Interpreting a horizontal bar graph. | |||||
|
|||||
|
Questions / instructions: |
|||||
 |
|||||
|
.
|
% responses | ||||
|
y4
|
|||||
|
1. Which vehicle was the fastest? |
car
|
96
|
|||
| 2. How far did the boat go? |
50
km
50 |
61
21 |
|||
| 3. How far did the motor bike go? |
65
km
65 |
31
8 |
|||
| 4. How much farther did the boat go than the tractor? |
30
km
30 |
29
6 |
|||
|
Total score: 6–7
4–5 2–3 0–1 |
19
23 33 15 |
||||