|
|
:
What's Happening |
|
|
|||||
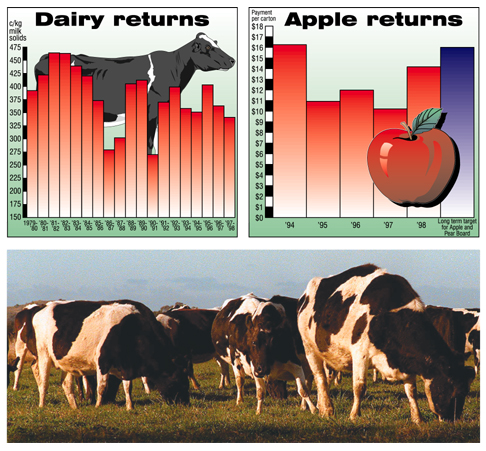
| Focus: Interpreting a bar graph. | |||||
|
|||||
|
Questions / instructions: |
|||||
 |
|||||
|
.
|
% responses | ||||
|
y8
|
|||||
|
1. Which year was the hardest for an apple farmer? |
1997
|
79
|
|||
| 2. How much did a farmer get for a box of apples in 1994? |
$16 – $16.50
16 – 16.5 4 |
88
4 |
|||
| 3. In which years were farmers paid 275 cents for each kg of milk solids? |
both
86–87 & 90–91
one of 86–87, 90–91 |
3
73 |
|||
| 4. What were the best years for a New Zealand dairy farmer? |
both
81–82 & 82–83
one of 81–82, 82–83 |
27
54 |
|||
| Commentary: Most year 8 students identified only one of the correct responses to questions 3 and 4. |
|||||