|
|||||||||||||||
|
|||||||||||||||
%
responses 2007 ('03) |
|||||||||||||||
y4 |
y8 |
||||||||||||||
|
|||||||||||||||
| Table format used: |
table (4 cells, 2 by 2) |
6 (5) |
31 (27) |
||||||||||||
table (other) |
39 (30) |
43 (47) |
|||||||||||||
| Labelled rows/columns for:
|
children and adults |
59 (62) |
88 (90) |
||||||||||||
weekdays and weekend |
53 (51) |
88 (86) |
|||||||||||||
| Four numbers all correct,
using: |
digits |
5 (2) |
5 (2) |
||||||||||||
tallies or dots |
54 (62) |
83 (86) |
|||||||||||||
Total
score: |
6 |
6 (5) |
29 (26) |
||||||||||||
5 |
24 (21) |
37 (40) |
|||||||||||||
4 |
19 (26) |
19 (18) |
|||||||||||||
2–3 |
18 (16) |
7 (10) |
|||||||||||||
0–1 |
34 (33) |
8 (6) |
|||||||||||||
| Subgroup Analysis [Click on charts to enlarge] : |
Year 4 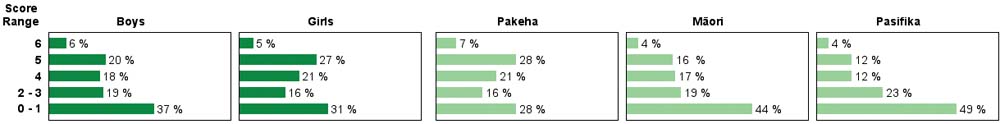 |
||
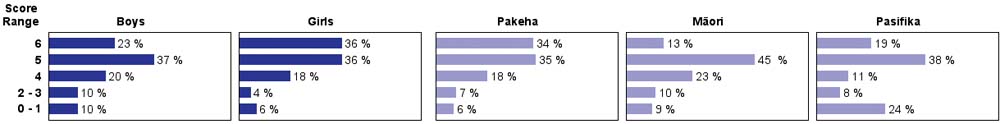
| Commentary: |
| Students experienced some difficulty in constructing an efficient table from data presented in verbal form, particularly at year 4. Most students did not see how the information could be laid out in a simple 2 x 2 table. Performance was very similar in 2003 and 2007. Performance of year 8 Pasifika students was particularly diverse, with 19% getting the maximum score and 24% scoring zero. |