|
||||||||||||||
|
||||||||||||||
%
responses |
||||||||||||||
y8 |
||||||||||||||
| Appropriate title: |
temperatures outside |
1 |
||||||||||||
temperatures |
8 |
|||||||||||||
| Appropriate qualification in title: |
different times of the day (Monday)
mentioned in title |
6 |
||||||||||||
different times mentioned in title |
0 |
|||||||||||||
| Position of title: |
above graph |
8 |
||||||||||||
below graph |
0 |
|||||||||||||
| Bottom axis (time): | appropriate axis label and all five times
appropriately given (am/pm not necessary) |
33 |
||||||||||||
approriate axis label, but not all
5 times appropriately given |
2 |
|||||||||||||
all times given, but no appropriate axis label |
51 |
|||||||||||||
| Side axis (temperature): | appropriate axis label and
appropriate numbering |
38 |
||||||||||||
appropriate axis label, but not
appropriate number labelling |
4 |
|||||||||||||
appropriate number labelling,
but no appopriate axis label |
31 |
|||||||||||||
| Drawing of graph: | 6.00am – |
5 marked correctly |
72 |
|||||||||||
9.00am – |
7 marked correctly |
73 |
||||||||||||
12:00pm – |
18 marked correctly |
66 |
||||||||||||
3.00pm – |
23 marked correctly |
67 |
||||||||||||
6.00pm – |
12 marked correctly |
71 |
||||||||||||
| Line drawn: (i.e. marks connected up with line) |
yes, tidily between marked points |
44 |
||||||||||||
yes, but quite roughly |
21 |
|||||||||||||
Total
score: |
14–18 |
7 |
||||||||||||
11–13 |
23 |
|||||||||||||
8–10 |
23 |
|||||||||||||
5–7 |
25 |
|||||||||||||
0–4 |
22 |
|||||||||||||
| Subgroup Analysis [Click on charts to enlarge] : |
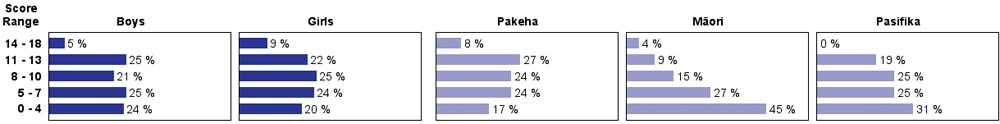
| Commentary: |
| As was found with other relatively unstructured tasks, many students failed to provide appropriate labels for their graph and
its axes. The data points were more commonly recorded correctly. Almost half of the Mäori students had very low scores. |