|
|||||||||||||
|
|||||||||||||
%
responses 2007 ('03) |
|||||||||||||
y4 |
y8 |
||||||||||||
| 1. How many children said playing sport
was their favourite free time activity? |
|||||||||||||
6 |
59 (62) |
92 (91) |
|||||||||||
3 |
27 (24) |
4 (5) |
|||||||||||
| 2. How many children said being with their friends was their favourite free time activity? | |||||||||||||
7 |
61 (63) |
92 (93) |
|||||||||||
| 3. What free time activity did most children in Room One say was their favourite? | |||||||||||||
TV |
83 (86) |
94 (95) |
|||||||||||
| 4. Two more children said they liked
playing sport. Put this information
on the graph. |
|||||||||||||
drew a circle on to “Sport” |
45 (48) |
76 (76) |
|||||||||||
drew two circles on to “Sport” |
23 (22) |
10 (10) |
|||||||||||
Total
score: |
6 |
36 (38) |
70 (71) |
||||||||||
5 |
11 (11) |
9 (7) |
|||||||||||
4 |
13 (15) |
13 (14) |
|||||||||||
3 |
17 (14) |
4 (5) |
|||||||||||
0–2 |
24 (22) |
4 (3) |
|||||||||||
| Subgroup Analysis [Click on charts to enlarge] : |
Year 4 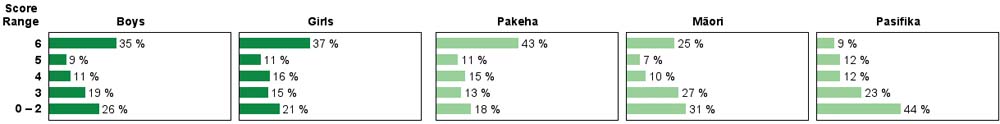 |
||
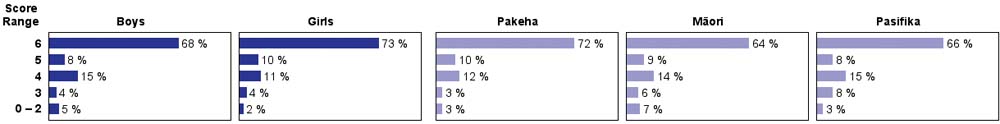
| Commentary: |
| Strong growth from year 4 to year 8 is seen in the ability to interpret a pictograph. While year 4 children had some difficulties with issues such as the units involved in the graph, year 8 children generally had little difficulty with the task. Performance was very similar in 2003 and 2007, and for boys and girls. Most year 4 Pasifika students scored half marks or lower but at year 8, all three ethnic groups performed similarly. |