|
||||||||||||||
|
||||||||||||||
|
%
responses 2007 ('03) |
|||||||||||||
y4 |
y8 |
|||||||||||||
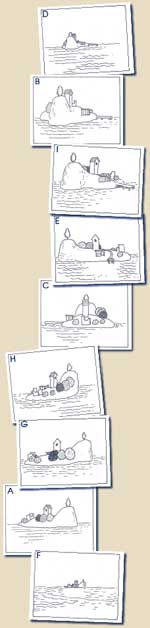 |
1. Put the pictures in the order that they were taken as the sailor went round the island. The first one has been done for you. | |||||||||||||
Picture 1 = |
D |
|||||||||||||
Picture 2 = |
B |
44 (37) |
77 (78) |
|||||||||||
Picture 3 = |
I |
34 (32) |
73 (75) |
|||||||||||
Picture 4 = |
E |
37 (38) |
75 (78) |
|||||||||||
Picture 5 = |
C |
30 (29) |
68 (72) |
|||||||||||
Picture 6 = |
H |
24 (25) |
59 (58) |
|||||||||||
Picture 7 = |
G |
28 (29) |
59 (58) |
|||||||||||
Picture 8 = |
A |
24 (23) |
59 (58) |
|||||||||||
Picture 9 = |
F |
57 (62) |
86 (90) |
|||||||||||
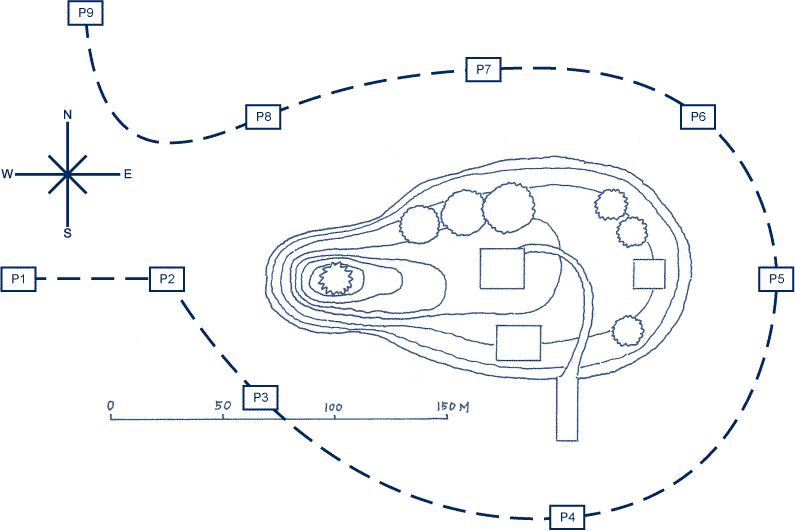
2. Which compass direction did
the sailor come from? |
West |
31 (42) |
49 (49) |
|||||||||||
Total score: |
8–9 |
9 (8) |
44 (42) |
|||||||||||
6–7 |
11 (11) |
19 (20) |
||||||||||||
4–5 |
17 (15) |
14 (18) |
||||||||||||
2–3 |
27 (28) |
13 (12) |
||||||||||||
0–1 |
36 (38) |
10 (8) |
||||||||||||
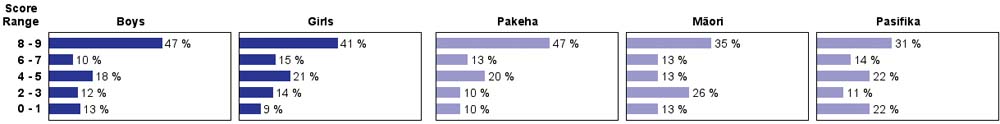
| Subgroup Analysis [Click on charts to enlarge] : |
Year 4 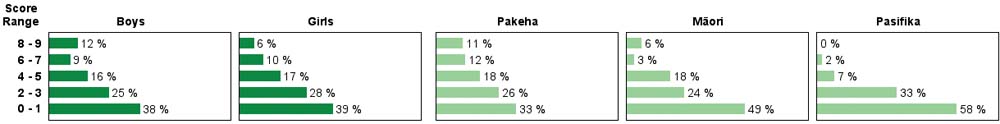 |
||
| Commentary: |
| The ability of students to interpret a topographical map improved greatly from year 4 to year 8. Most year 4 students had very limited success, whereas most year 8 students had little or no difficulty. Performance was similar in 2003 and 2007. Year 4 Pasifika students had more trouble than Mäori or Pakeha students, but the differences declined by year 8. |