|
|||||||||||||
|
|||||||||||||
%
responses |
|||||||||||||
y4 |
y8 |
||||||||||||
| The table shows items sold in the school shop. | |||||||||||||
| 1. How many more pencils than rulers were sold? | 2 |
52 |
85 |
||||||||||
| 2. How many more pens than erasers were sold? | 10 |
42 |
80 |
||||||||||
| 3. How many pens and pencils were sold? | 48 |
52 |
80 |
||||||||||
Total
score: |
3 |
24 |
61 |
||||||||||
2 |
23 |
26 |
|||||||||||
1 |
26 |
10 |
|||||||||||
0 |
27 |
3 |
|||||||||||
| Subgroup Analysis [Click on charts to enlarge] : |
Year 4 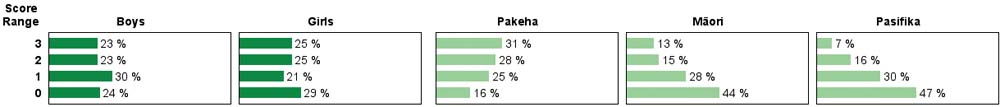 |
||
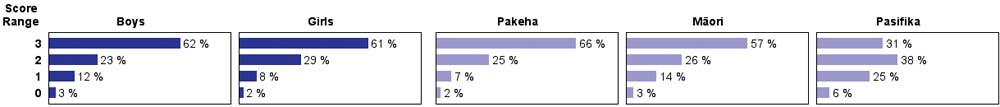
| Commentary: |
| Many year 4 students had trouble with this task involving reading a chart and doing simple calculations based on the information presented. Year 8 students were much more successful. There were strong differences by ethnicity at year 4, but year 8 Pakeha and Mäori students performed similarly well. |