|
|||||||||||||
|
|||||||||||||
% responses 2007 ('95) |
|||||||||||||
y4 |
y8 |
||||||||||||
| 1. How many towns are shown on the map? | 4 |
82 (82) |
94 (96) |
||||||||||
| 2. How many walkways are shown on the map? | 3 |
47 (42) |
82 (76) |
||||||||||
| 3. Does the map show more sea or more land? | more land |
81 (79) |
88 (89) |
||||||||||
| 4. What does the line from Sunnyville to Kowhai mean? | main road |
44 (31) |
72 (84) |
||||||||||
| 5. Is Sunnyville north or south of Kauri? | north |
58 (56) |
74 (70) |
||||||||||
| 6. Which town will you have to pass through when going from Sunnyville to Kauri? | Wilton |
76 (78) |
93 (95) |
||||||||||
Total
score: |
6 |
15 (7) |
43 (42) |
||||||||||
5 |
20 (22) |
32 (35) |
|||||||||||
4 |
30 (29) |
13 (16) |
|||||||||||
3 |
21 (23) |
9 (5) |
|||||||||||
0–2 |
15 (19) |
3 (2) |
|||||||||||
| Subgroup Analysis [Click on charts to enlarge] : |
Year 4 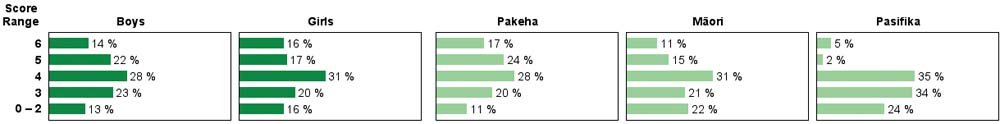 |
||
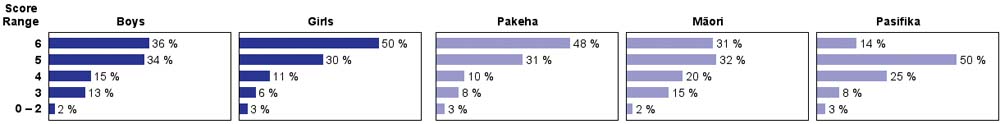
| Commentary: |
| There was strong growth from year 4 to year 8 in the ability to read a simple map. Three quarters of year 8 students were able to answer all, or all but one, of the questions. There were no gender differences, and little change from 1995, when the task was first administered, to 2007. |