|
 Attitudes and Motivation
The national monitoring
assessment programme recognizes the impact of attitudinal and motivational
factors on student achievement in individual assessment tasks. Students’
attitudes, interests and liking for a subject have a strong bearing
on progress and learning outcomes. Students are influenced and shaped
by the quality and style of curriculum delivery, the choice of content
and the suitability of resources. Other important factors influencing
students’ achievements are the expectations and support of significant
people in their lives, the opportunities and experiences they have in
and out of school, and the extent to which they have feelings of personal
success and capability.
Health
and Physical Education Surveys
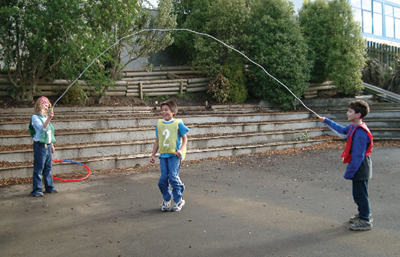
The national
monitoring health and physical education surveys sought information
from students about their curriculum preferences and their perceptions
of their achievement. Students were also asked about their involvement
in health and physical education activities within school and beyond.
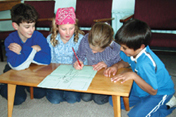
The surveys were administered to both year 4 and year 8 students in
groups of four students, with most questions requiring short written
answers and others a written response. Teacher help with reading or
writing was provided where requested.
There are numerous research questions that could be asked when investigating
student attitudes and engagement. In national monitoring it has been
necessary to focus on a few key questions that give an overall impression
of how students view health and physical education as school, home and
community activities.
|
| |
|
The health survey
included an item which asked students to indicate preferred subjects
at school, an item which asked them to indicate preferred and disliked
health activities at school, four items which invited students to record
a rating response, and one item which sought open-ended responses (and
is not reported here).
The students were first asked to select their three favourite school
subjects from a list of twelve subjects. The results are shown in the
table adjacent, together with the corresponding 1998 figures. Physical
education was the most popular option for year 8 students and the second
most popular option for year 4 students. Health was last equal at both
year levels.
|
Three
Favourites:
Percentages of students rating subjects among their
3 favourites |
%
responses
2002
('98) |
| y4 |
y8 |
| Subject:
|
Art
|
71
(72) |
49
(47) |
| |
Physical
Education |
57 (67) |
62
(69) |
| |
Mathematics
|
36
(36) |
28
(30) |
| |
Reading
|
29
(23) |
18
(15) |
| |
Science
|
26
(20) |
21
(23) |
| |
Music
|
26
(24) |
25
(19) |
| |
Writing
|
21
(16) |
7
(12) |
| |
Technology
|
10
(15) |
48
(39) |
| |
Mäori
|
8
(10) |
6
(8) |
| |
Social
Studies |
3
(5) |
10
(14) |
| |
Speaking
|
2
(5) |
10
(11) |
| |
Health
|
2
(2) |
6
(2) |
|
HEALTH
ACTIVITIES – LIKES AND DISLIKES:
|
%
responses
2002
('98) |
| Activity
– |
y4 |
y8 |
LIKE |
DISLIKE |
LIKE |
DISLIKE |
Friendships
|
50 |
8 |
45 |
8 |
| How
to care for others |
37 |
6 |
18 |
11 |
| How
to care for myself |
36 |
11 |
28 |
15 |
| Families
|
30 |
10 |
19 |
12 |
| How
to keep safe |
23 |
12 |
33 |
16 |
| Food
and healthy eating |
22 |
14 |
40 |
16 |
| How
to keep healthy |
15 |
11 |
27 |
14 |
| How
to get on with others |
16 |
15 |
19 |
18 |
| How
my body works and how to care for it |
16 |
18 |
30 |
18 |
| My
feelings and how to feel good about myself |
9 |
20 |
16 |
29 |
|
The students were presented
with a list of thirteen health activities and asked which they
liked doing most at school. They were invited to tick up to three
activities. They were also asked to indicate activities that they
did not like doing at school, by putting crosses alongside up
to three activities. Their responses are shown adjacent.
|
|
|  Many
of the activities were viewed quite differently by year 4 and year 8
students. For instance, How to care for others and Families
were popular with year 4 students, but much less popular with year 8
students. On the other hand, Food and healthy eating, How to keep
healthy, and How to keep safe were distinctly more popular
with year 8 than year 4 students. Both year levels agreed that activities
about Friendships were particularly liked, while My feelings
and how to feel good about myself was more disliked than liked. Many
of the activities were viewed quite differently by year 4 and year 8
students. For instance, How to care for others and Families
were popular with year 4 students, but much less popular with year 8
students. On the other hand, Food and healthy eating, How to keep
healthy, and How to keep safe were distinctly more popular
with year 8 than year 4 students. Both year levels agreed that activities
about Friendships were particularly liked, while My feelings
and how to feel good about myself was more disliked than liked.
Responses to the four rating items are presented in separate tables
for year 4 students and year 8 students below. Between 1998 and 2002,
the percentage of year 4 students awarding the highest rating on each
of the first three questions has declined markedly. Both year 4 and
year 8 students continue to be very positive about the usefulness of
learning about health (question 2), despite the slippage for year 4
students. The responses to question 4 indicated that only 39 percent
of year 4 students and 33 percent of year 8 students believed their
class did things that helped them learn about health “lots”
or “quite a lot”. These figures were essentially unchanged
between 1998 and 2002. As found in NEMP surveys for most other curriculum
areas, a substantially lower percentage of year 8 students than year
4 students gave the highest ratings to learning about health in school,
currently and in the future (questions 1 and 3), often preferring the
second most positive response.
|
| Year
4 – Health Survey Responses |
%
responses 2002 (1998) |
| |
 |
 |
 |
|
| 1.
How much do you like doing health education at school?
|
41
(51) |
43
(34) |
10
(9) |
6
(6) |
| |
|
|
|
|
| 2.
Do you think learning about health education is useful to you
at school and out of school?
|
67
(75) |
24
(17) |
5
(3) |
4
(5) |
| |
|
|
|
|
| 3.
How do you feel about learning or doing more health education
as you get older?
|
49
(61) |
37
(27) |
9
(7) |
5
(5) |
| |
lots
|
quite
a lot |
sometimes
|
never |
| 4.
How often does your class do things that help you learn about
health?
|
18
(15) |
21
(25) |
56
(55) |
5
(5) |
| |
|
|
|
|
|
| |
| Year
8 – Health Survey Responses |
%
responses 2002 (1998) |
| |
|
|
|
|
| 1.
How much do you like doing health education at school?
|
22
(22) |
61
(58) |
15
(16) |
2
(6) |
| |
|
|
|
|
| 2.
Do you think learning about health education is useful to you
at school and out of school?
|
57
(64) |
36
(31) |
7
(4) |
0
(1) |
| |
|
|
|
|
| 3.
How do you feel about learning or doing more health education
as you get older?
|
28
(31) |
53
(51) |
16
(13) |
3
(5) |
| |
lots
|
quite
a lot |
sometimes
|
never |
| 4.
How often does your class do things that help you learn about
health?
|
6
(9) |
27
(22) |
65
(66) |
2
(3) |
| |
|
|
|
|
|
| PHYSICAL
EDUCATION SURVEY |
 126kb 126kb |
|
The
physical education survey included one item that invited students to
indicate preferred physical education activities at school, another
that asked about preferences for different approaches to physical education
activities, and nine items that invited them to record a rating response.
There were also seven items that asked them to write open-ended responses.
Only some of the open-ended items are analysed and reported here.
|
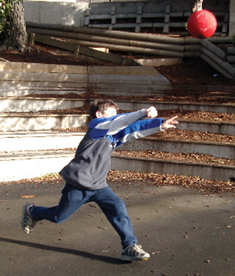
| The
students were then presented with a list of seven activities that
they might do in physical education at school, and were asked to
tick up to three activities that they most like to do. The responses
are shown adjacent, ordered from most to least popular for year
4 students. The notable differences between year 4 and year 8 responses
are the lower enthusiasm of year 8 students for swimming (particularly),
gymnastics and dance, and their higher enthusiasm for ball activities. |
PREFERRED
PHYSICAL EDUCATION ACTIVITIES: |
%
responses
|
| y4 |
y8 |
| Activity
– |
swimming/aquatics
|
62 |
34 |
| |
ball
activities |
57 |
70 |
| |
gymnastics
|
40 |
24 |
| |
athletics
|
31 |
39 |
| |
dance
|
31 |
21 |
| |
fitness
|
25 |
24 |
| |
Te
reo kori (Mäori activities) |
6 |
7 |
|
|
PREFERRED
WAY OF DOING PHYSICAL EDUCATION ACTIVITIES: |
%
responses
|
| y4 |
y8 |
| Approach
– |
class
games |
56 |
64 |
| |
doing
things in teams |
51 |
55 |
| |
school
sports days |
48 |
47 |
| |
playing
for fun (not winning or losing) |
42 |
50 |
| |
competitions
(winning or losing) |
40 |
39 |
| |
doing
things on your own |
19 |
9 |
|
 The
students were then presented with a list of six ways of doing
physical education activities, and were asked to tick up to three
ways that they liked. The responses are shown adjacent, ordered
from most to least popular for year 4 students. The patterns are
very similar for year 4 and year 8 students. The
students were then presented with a list of six ways of doing
physical education activities, and were asked to tick up to three
ways that they liked. The responses are shown adjacent, ordered
from most to least popular for year 4 students. The patterns are
very similar for year 4 and year 8 students. |
|
When
asked to write down up to three very important things a person needs to
learn or do to be good in physical education, year 4 students overwhelmingly
emphasized physical or game skills, with subsidiary emphasis on fitness
and then sportsmanship. Year 8 students gave more balanced responses,
with fitness the most common choice, closely followed by three almost
equally popular options: good sportsmanship, positive attitudes and effort,
and physical or game skills.
When asked to write down three really important things they had learned
in physical education, large majorities of both year 4 and year 8 students
mentioned the rules, techniques or skills of particular activities or
games. Good sportsmanship and positive attitudes or effort came next for
both year levels, but were mentioned by only 20 to 30 percent of students.
Ideas mentioned even less frequently included the importance of fitness,
warm-ups or stretches, having fun, training or practising, and learning
to cooperate with others.
When asked to list interesting things done in physical education in their
own time, team ball activities and individual non-ball activities were
each mentioned by 41 percent of year 4 students, with general play mentioned
by 31 percent. The corresponding year 8 figures were 52 percent (team
ball activities), 41 percent (individual non-ball activities), and 13
percent (general play). One other category was reasonably popular for
year 8, but not year 4 students: individual ball activities, mentioned
by 16 percent of year 8 students.
 Responses to the 9 rating items are presented below in separate tables
for year 4 students and year 8 students. The results show that year 8
students were almost as enthusiastic as year 4 students about physical
education. In most other curriculum areas assessed in NEMP, use of the
most positive rating declines substantially from year 4 to year 8. Year
8 students were less positive (perhaps more realistic) than year 4 students
about how good they were at physical education, and about how good others
thought that they were. Year 8 students reported a little more vigorous
physical activity than year 4 students in the 24 hours preceding the survey.
About 30 percent of students at both levels stated that they didn’t
know how good their teacher thought they were at physical education.
Responses to the 9 rating items are presented below in separate tables
for year 4 students and year 8 students. The results show that year 8
students were almost as enthusiastic as year 4 students about physical
education. In most other curriculum areas assessed in NEMP, use of the
most positive rating declines substantially from year 4 to year 8. Year
8 students were less positive (perhaps more realistic) than year 4 students
about how good they were at physical education, and about how good others
thought that they were. Year 8 students reported a little more vigorous
physical activity than year 4 students in the 24 hours preceding the survey.
About 30 percent of students at both levels stated that they didn’t
know how good their teacher thought they were at physical education.
The ratings were similar in 1998 and 2002, especially at year 4 level.
There was a small decline in enthusiasm (questions 1 and 6) for year 8
students, but an increase in the percentage of year 8 students reporting
more than 60 minutes of vigorous physical activity in the 24 hours preceding
the survey. |
Year
4 – Physical Education Survey Responses |
%
responses 2002 (1998) |
| |
|
|
|
|
don’t
know |
|
1.
How much do you like doing P.E. at school?
|
72
(74) |
19
(21) |
7
(3) |
2
(2) |
|
|
| |
|
|
|
|
|
|
2.
How good do you think you are at P.E?
|
61
(55) |
28
(32) |
5
(4) |
0
(1) |
6
(8) |
|
| |
|
|
|
|
|
|
3.
How good does your teacher think you are at P.E.?
|
38
(40) |
25
(23) |
4
(5) |
2
(1) |
31
(31) |
|
| |
|
|
|
|
|
|
4.
How good does your family think you are at P.E.?
|
72
(73) |
13
(10) |
2
(2) |
2
(2) |
11
(13) |
|
| |
|
|
|
|
|
|
5.
How do you feel about doing things in P.E. you haven’t tried
before?
|
53
(44) |
33
(40) |
10
(12) |
4
(4) |
|
|
| |
|
|
|
|
|
|
6.
How much do you like doing P.E. in you own time (not at school)?
|
62
(64) |
23
(22) |
10
(7) |
5
(7) |
|
|
| |
more |
about
the same |
less |
|
|
|
| 7.
Would you like to do more P.E. or less P.E. at school? |
72
(71) |
23
(22) |
5
(7) |
|
|
|
|
yes |
maybe/
not sure |
no |
|
|
|
| 8.
Do you want to keep learning P.E when you are older? |
61
(58) |
34
(37) |
5
(5) |
|
|
|
|
0
|
1–15
|
16–30 |
31–45
|
46–60 |
>60 |
| 9.
How many minutes of vigorous physical activities have you done since
this time yesterday? |
18
(15) |
27
(25) |
22
(21) |
3
(4) |
10
(17) |
20
(18) |
| |
|
|
|
|
|
|
|
Year
8 – Physical Education Survey Responses |
%
responses 2002 (1998) |
| |
|
|
|
|
don’t
know |
|
1.
How much do you like doing P.E. at school?
|
59
(68) |
29
(25) |
11
(6) |
1
(1) |
|
|
| |
|
|
|
|
|
|
2.
How good do you think you are at P.E?
|
35
(31) |
46
(54) |
10
(7) |
3
(1) |
6
(7) |
|
| |
|
|
|
|
|
|
3.
How good does your teacher think you are at P.E.?
|
23
(22) |
34
(33) |
9
(5) |
4 (1) |
30
(39) |
|
| |
|
|
|
|
|
|
4.
How good does your family think you are at P.E.?
|
45
(46) |
32
(26) |
5
(5) |
2
(1) |
16
(22) |
|
| |
|
|
|
|
|
|
5.
How do you feel about doing things in P.E. you haven’t tried
before?
|
45
(46) |
40
(43) |
13
(10) |
2
(1) |
|
|
| |
|
|
|
|
|
|
6.
How much do you like doing P.E. in you own time (not at school)?
|
47
(54) |
35
(34) |
15
(10) |
3
(2) |
|
|
|
more |
about
the same |
less |
|
|
|
| 7.
Would you like to do more P.E. or less P.E. at school? |
66
(65) |
30
(30) |
4
(5) |
|
|
|
|
yes |
maybe/
not sure |
no |
|
|
|
| 8.
Do you want to keep learning P.E when you are older? |
62
(62) |
36
(35) |
2
(3) |
|
|
|
|
0
|
1–15
|
16–30 |
31–45
|
46–60 |
>60 |
| 9.
How many minutes of vigorous physical activities have you done since
this time yesterday? |
19
(19) |
10
(15) |
14
(16) |
6
(8) |
14
(18) |
37
(24) |
| |
|
|
|
|
|
|
|