|
||||||||
The
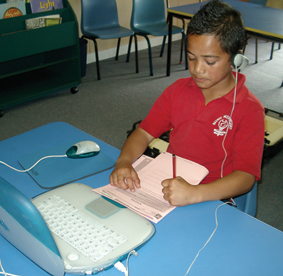
information skills survey asked students about their strategies for,
involvement in, and enjoyment of information-gathering activities. The
questions were the same for year 4 and year 8 students. The survey was
administered to the students in an independent-tasks session (four students
working individually on tasks, supported by a teacher). The questions
were read to year 4 students and also to individual year 8 students
who requested this help. The survey included eight questions which invited students to record a rating response by circling their choice and two questions which invited students to tick up to three options from a list (including an “other” option where students could describe an additional response). One item asked students to indicate where they usually go when trying to find information. They could tick up to three options. Their responses are shown here, in order of popularity for year 4 students, with 2001 percentages for comparison. |
 |
||||||||||||||||||||||||||||||||||||||||||||||||||||||||||||||||||
|
For
both year 4 and year 8 students, the internet was the most popular source
by a substantial margin. This represented a significant increase in
popularity over the past four years. Next most popular were the library
(probably the school library, given that the town library was listed
separately) and parents. Another item asked students to indicate what they do when they can’t find information they need. They could tick up to three options. Their responses are shown here, in order of popularity for year 4 students, with 2001 and 1997 percentages for comparison. |
||||||||||||||||||||||||||||||||||||||||||||||||||||||||||||||||||
 |
Compared to year 4 students, year 8 students placed less emphasis on keeping looking themselves, and more emphasis on asking their teacher. There has been little change in the responses over the eight years since the first survey in 1997. The remaining eight items used a rating format. The percentages of students choosing each response to these five questions are shown in the two tables opposite. Where available, 2001 and 1997 percentages are shown for comparative purposes. |
||||||||||||||||||||||||||||||||||||||||||||||||||||||||||||||||||
|
|||||||||||||||||||||||||||||||||||||||||||||||||||||||||||||||||||
|
|||||||||||||||||||||||||||||||||||||||||||||||||||||||||||||||||||
A
substantially greater proportion of year 8 than year 4 students reported
that they had to find information for a project or topic heaps or quite
a lot (question 1). Perhaps as a consequence of being given such tasks
more frequently, year 8 students were much less inclined than year 4
students to be enthusiastic about hunting for information (question
5) and about writing down the information they found (question 8). While
year 4 students responded similarly to questions 1 and 2, the pattern
was quite different for year 8 students, suggesting that many of the
information-finding projects which year 8 students were asked to attempt
were not viewed as “really interesting”. About 75 percent
of students are quite happy to share with others the information they
have found (question 7). Where comparisons with 2001 and 1997 responses
are possible, the results in 2005 are very similar to the results of
the earlier surveys, so the same conclusions apply. |
 |
||||||||||||||||||||||||||||||||||||||||||||||||||||||||||||||||||