|
||||||||||
|
|||||||||||
Questions/instructions:
|
|||||||||||
|
%
responses 2006 ('02) |
||||||||||
| y4 |
y8
|
||||||||||
|
D |
77 (75) |
93 (92) |
||||||||
 |
E |
63 (66) |
86 (85) |
||||||||
 |
C |
45 (51) |
67 (66) |
||||||||
 |
A |
80 (80) |
94 (94) |
||||||||
Total
score: |
4 |
35 (34) |
63 (59) |
||||||||
3 |
21 (25) |
21 (25) |
|||||||||
2 |
27 (26) |
12 (12) |
|||||||||
1 |
11 (9) |
4 (3) |
|||||||||
0 |
7 (6) |
2 (1) |
|||||||||

| Subgroup Analysis: |
Year 4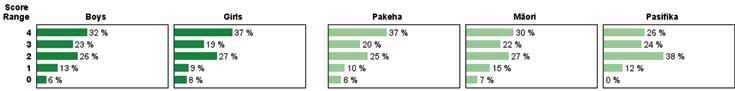 |
||
Year 8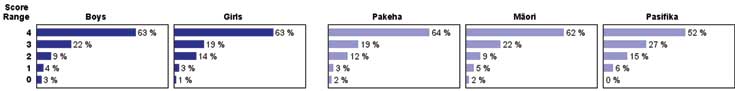 |
| Commentary: |
| Students did well on this task, which involved interpreting body language in pictures. Students in 2006 performed similarly to students in 2002. Year 8 students were almost twice as likely as year 4 students to match all four pictures correctly with their captions. There were no meaningful gender differences, or differences among Pakeha, Mäori and Pasifika students. |