|
|||||
|
|
||||||
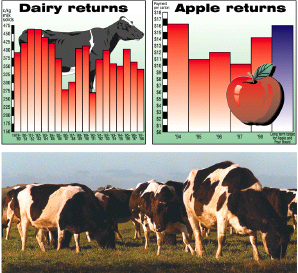
| Focus: Interpreting a bar graph. | ||||||
|
||||||
|
Questions / instructions: |
||||||
|
%
responses
|
||||||
|
GEd
|
MI
|
|||||
 Select image for English and Mäori versions |
1. Which year was the hardest for an apple farmer? |
66
|
61
|
|||
| Ko tëhea te tau tino uaua rawa atu ki te kaiahuwhenua [farmer] äporo? | ||||||
|
1997
|
||||||
| 2. How much did a farmer get for a box of apples in 1994? |
74
|
77
|
||||
| E hia te whiwhinga a te kaiahuwhenua mö tëtahi pouaka [carton] äporo i te tau 1994? | ||||||
|
$16
– $16.50
|
||||||
|
16
– 16.5
|
9
|
5
|
||||
| 3. In which years were farmers paid 275 cents for each kg of milk solids? | ||||||
| Ko ëhea tau i utua ai te 275 hëneti ki ngä kaiahuwhenua mö ia kirokarama utoka miraka [milk solids]? | ||||||
|
both
86–87 & 90–91
|
7
|
2
|
||||
|
one
of 86–87, 90–91
|
71
|
68
|
||||
| 4. What were the best years for a New Zealand dairy farmer? | ||||||
| Ko ëhea ngä tau tino pai rawa atu ki tëtahi kaiahuwhenua miraka kau [dairy farmer] o Aotearoa? | ||||||
|
both
81–82 & 82–83
|
29
|
18
|
||||
|
one
of 81–82, 82–83
|
48
|
37
|
||||
| Commentary:
Overall, the results obtained by MI (Mäori immersion) and GEd (General Education) students were not statistically significantly different. |
||||||
|
|
||
|
|
||