|
|||||||
|
||||||||||
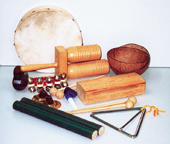
| Focus: Composing sounds, using voices and selected instruments, to match the flow of a line on a chart. | ||||||||||
|
||||||||||
| Questions
/ instructions:
Show chart
We have a variety of instruments here for making sounds. You could also use yourself to make sounds - like clapping, stamping, or mouth sounds. I want you to work
together as a team to make up some music to match the lines on this
chart. Plan it out carefully. Choose instruments that are suitable,
and try to make the music so that it gives a good "sound picture"
for the line as it moves along on the chart. |
||||||||||
| %
responses 2000 (1996) |
||||||||||
| y4
|
y8
|
|||||||||
| VOCAL PERFORMANCE | ||||||||||
| Inventiveness | appropriate range / choice of sounds | |||||||||
| strong
|
18
(7) |
30
(23) |
||||||||
| moderate
|
34
(50) |
36
(62) |
||||||||
| weak
|
48
(43) |
34
(15) |
||||||||
| Interpretation | sequence and choice of sounds give a meaningful interpretation of the line (pitch, tempo, volume) | |||||||||
|
strong |
22
(14) |
39
(35) |
||||||||
|
moderate |
46
(65) |
40
(42) |
||||||||
| weak
|
32
(21) |
21
(23) |
||||||||
| Delivery | performance is effectively co-ordinated and presented | |||||||||
| strong
|
29
(29) |
45
(42) |
||||||||
| moderate
|
40
(42) |
38
(39) |
||||||||
|
weak |
43
(55) |
19
(22) |
||||||||
| INSTRUMENTAL PERFORMANCE | ||||||||||
|
Inventiveness |
strong
|
11
(0) |
34
(33) |
|||||||
| moderate
|
46
(45) |
47
(45) |
||||||||
| weak
|
31
(29) |
17
(19) |
||||||||
| Interpretation |
strong |
8
(0) |
29
(33) |
|||||||
| moderate
|
35
(34) |
51
(41) |
||||||||
| weak
|
57
(66) |
20
(26) |
||||||||
| Delivery |
strong |
16
(14) |
51
(41) |
|||||||
| moderate
|
49
(24) |
42
(44) |
||||||||
| weak
|
35
(62) |
7
(15) |
||||||||
| Commentary:
On average, about 15 percent more year 8 than year 4 groups achieved "strong" results on the vocal performance criteria, increasing to 25 percent on the instrumental performance criteria. There was evidence of some improvment on the instrumental performance criteria between 1996 and 2000. Increased percentages of "strong" performance on the vocal performance criteria were unfortunately often accompanied by increased percentages of "weak" performance. |
||||||||||
|
|
|
|