|
||||||||||||||||
|
||||||||||||||||
%
responses 2008 ('04) |
||||||||||||||||
y4 |
y8 |
|||||||||||||||
| Relevance of comments
to topic: |
strong |
21 (27) |
25 (40) |
|||||||||||||
moderate |
67 (60) |
63 (53) |
||||||||||||||
weak |
12 (13) |
12 (7) |
||||||||||||||
| Clarity of individual comments: (extent to which listener can picture these aspects/content of message/feeling/picture) |
strong |
11 (18) |
15 (24) |
|||||||||||||
moderate |
51 (40) |
54 (57) |
||||||||||||||
weak |
38 (42) |
31 (19) |
||||||||||||||
| Coherence of whole presentation: (does it all hang together) |
strong |
13 (20) |
16 (24) |
|||||||||||||
moderate |
49 (42) |
52 (56) |
||||||||||||||
weak |
38 (38) |
32 (20) |
||||||||||||||
| Communication of personal
feeling about place: |
strong and explicit feeling |
6 (8) |
11 (12) |
|||||||||||||
implicit tone conveyed |
22 (20) |
26 (34) |
||||||||||||||
little/some feeling conveyed |
42 (32) |
41 (41) |
||||||||||||||
very weak |
30 (40) |
22 (13) |
||||||||||||||
| Overall effectiveness in creating a
vivid, interesting place: (rich language throughout) |
very strong |
1 (6) |
2 (5) |
|||||||||||||
quite strong |
11 (14) |
16 (19) |
||||||||||||||
moderate |
33 (22) |
38 (39) |
||||||||||||||
weak |
55 (58) |
44 (37) |
||||||||||||||
Total
score: |
8–12 |
14 (20) |
21 (30) |
|||||||||||||
6–7 |
15 (13) |
18 (21) |
||||||||||||||
4–5 |
26 (17) |
25 (26) |
||||||||||||||
2–3 |
23 (21) |
17 (13) |
||||||||||||||
0–1 |
22 (29) |
19 (10) |
||||||||||||||
| Subgroup Analysis [Click on charts to enlarge] : |
Year 4 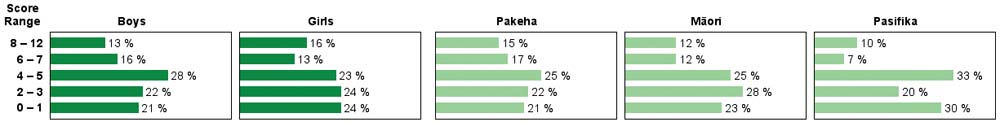 |
||
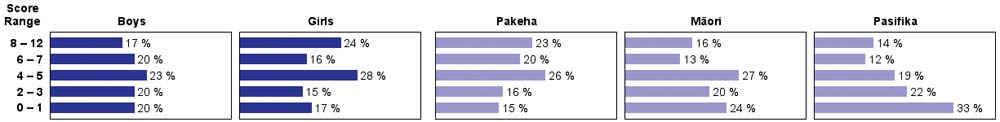
| Commentary: |
| There was a wide range of performance on this task at both year levels. Differences among the subgroups were small, particularly for year 4 students. Between 2004 and 2008, the range of performance narrowed a little for year 4 students, while there was a moderate decline in average performance among year 8 students.
|