|
||||||||||||||
|
||||||||||||||
%
responses 2007 ('03) |
||||||||||||||
y4 |
y8 |
|||||||||||||
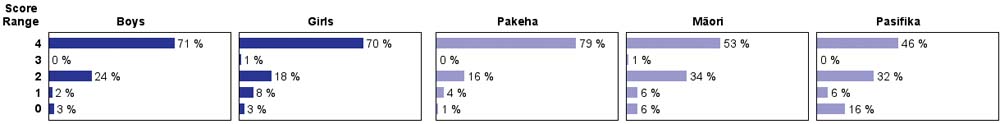
thrush eats snail |
76 (81) |
91 (96) |
||||||||||||
ladybird eats aphid |
54 (63) |
76 (82) |
||||||||||||
hedgehog eats snail and slug |
60 (64) |
81 (84) |
||||||||||||
snail eats plants |
68 (69) |
83 (87) |
||||||||||||
Total
score: |
4 |
46 (52) |
71 (78) |
|||||||||||
3 |
0 (0) |
0 (0) |
||||||||||||
2 |
29 (29) |
21 (16) |
||||||||||||
1 |
16 (12) |
5 (5) |
||||||||||||
0 |
9 (7) |
3 (1) |
||||||||||||
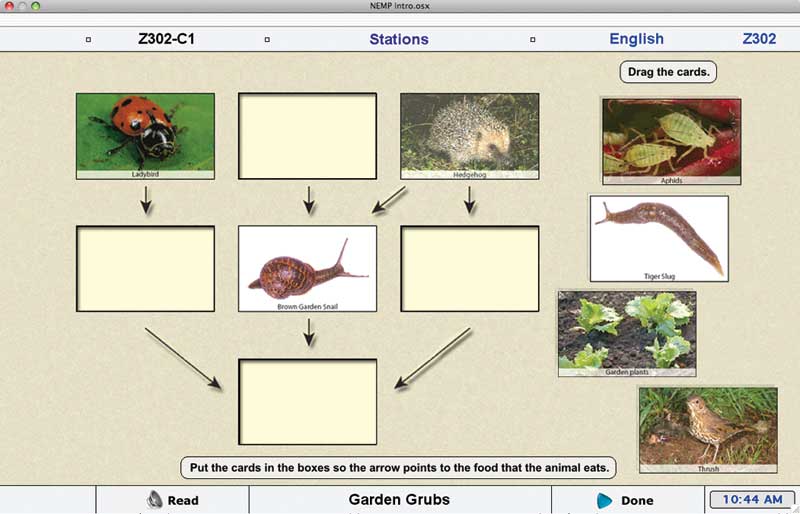
| Subgroup Analysis [Click on charts to enlarge] : |
Year 4 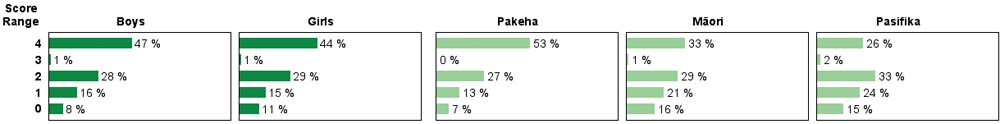 |
||
| Commentary: |
| Students showed substantial progress between year 4 and year 8, with little change between 2003 and 2007. At year 8 level, there were particularly large performance differences between Pakeha and Mäori students, and between Pakeha and Pasifika students. |