|
||||||||||||||
|
||||||||||||||
| Click on graphic to enlarge. | %
responses 2007 ('03) |
|||||||||||||
y4 |
y8 |
|||||||||||||
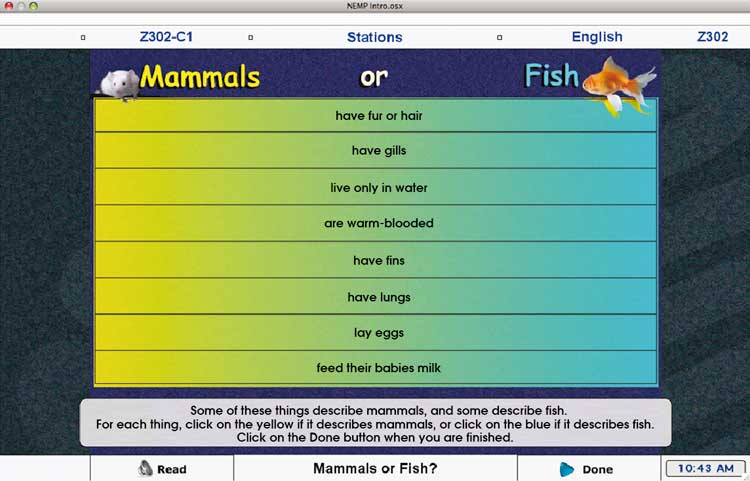
| Mammals: |
have fur or hair |
98 (96) |
99 (98) |
|||||||||||
are warm-blooded |
96 (94) |
99 (97) |
||||||||||||
have lungs |
97 (95) |
98 (97) |
||||||||||||
feed their babies milk |
89 (86) |
94 (95) |
||||||||||||
| Fish: |
have gills |
98 (95) |
99 (96) |
|||||||||||
live only in water |
87 (81) |
90 (88) |
||||||||||||
have fins |
59 (58) |
82 (76) |
||||||||||||
lay eggs |
97 (93) |
99 (97) |
||||||||||||
Total
score: |
8 |
47 (45) |
71 (67) |
|||||||||||
7 |
34 (32) |
19 (22) |
||||||||||||
6 |
16 (16) |
8 (8) |
||||||||||||
0–5 |
3 (7) |
2 (3) |
||||||||||||
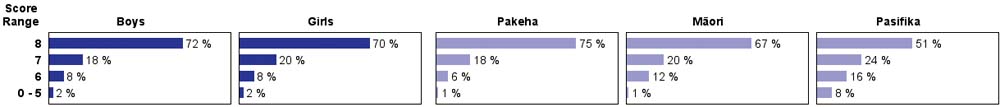
| Subgroup Analysis [Click on charts to enlarge] : |
Year 4 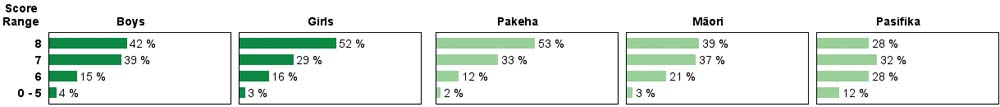 |
||
| Commentary: |
| Students performed very well on this task. Because of the high scores, there was limited potential for improvement from year 4 to year 8. Results were very similar at both year levels in 2003 and 2007. |