|
||||||||||||||
|
||||||||||||||
%
responses 2007 ('03) |
||||||||||||||
y4 |
y8 |
|||||||||||||
| 1. Write down five questions that would help you to understand more about spiders. |
||||||||||||||
| Amount of relevant information
that could be expected to be
triggered by: |
Question 1: |
quite a lot |
18 (20) |
21 (13) |
||||||||||
some (e.g. a specific fact) |
67 (65) |
72 (82) |
||||||||||||
Question 2: |
quite a lot |
14 (16) |
17 (17) |
|||||||||||
some (e.g. a specific fact) |
71 (68) |
74 (72) |
||||||||||||
Question 3: |
quite a lot |
13 (13) |
17 (17) |
|||||||||||
some (e.g. a specific fact) |
68 (69) |
74 (74) |
||||||||||||
Question 4: |
quite a lot |
11 (8) |
12 (17) |
|||||||||||
some (e.g. a specific fact) |
64 (70) |
74 (72) |
||||||||||||
Question 5: |
quite a lot |
10 (8) |
14 (14) |
|||||||||||
some (e.g. a specific fact) |
57 (65) |
69 (74) |
||||||||||||
| 2. Put ticks beside three of your questions that could get the most interesting answers. |
||||||||||||||
| Overall score for questions chosen: | 6 |
1 (4) |
3 (4) |
|||||||||||
5 |
7 (4) |
10 (10) |
||||||||||||
4 |
20 (17) |
19 (20) |
||||||||||||
3 |
40 (47) |
46 (45) |
||||||||||||
2 |
14 (16) |
7 (7) |
||||||||||||
1 |
3 (3) |
3 (1) |
||||||||||||
0 |
15 (9) |
12 (13) |
||||||||||||
| 3. You can get answers from books or computers. Where else could you go for answers to your questions? |
||||||||||||||
direct observation/experiments
with spiders |
7 (7) |
10 (9) |
||||||||||||
ask experts (e.g. scientist, museum) |
46 (41) |
46 (45) |
||||||||||||
ask readily available people
(e.g. parents, siblings, friends, teachers) |
32 (29) |
42 (47) |
||||||||||||
other resource material (e.g. video, tv, magazines, library) |
33 (37) |
36 (42) |
||||||||||||
Total
score: |
11–16 |
15 (14) |
17 (20) |
|||||||||||
9–10 |
17 (20) |
21 (20) |
||||||||||||
7–8 |
34 (38) |
41 (38) |
||||||||||||
5–6 |
16 (15) |
11 (15) |
||||||||||||
0–4 |
18 (13) |
10 (7) |
||||||||||||
| Subgroup Analysis [Click on charts to enlarge] : |
Year 4 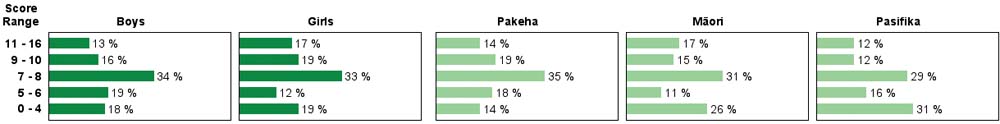 |
||
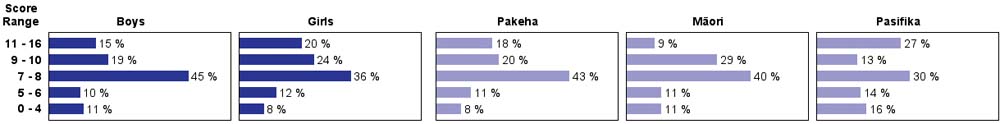
| Commentary: |
| This task showed very similar results for year 4 and year 8 students, and little change between 2003 and 2007. The performance of year 8 Pasifika students varied widely: they achieved the largest percentage in both the highest score band and the lowest score band. |