|
||||||||||||||
|
||||||||||||||
%
responses |
||||||||||||||
y8 |
||||||||||||||
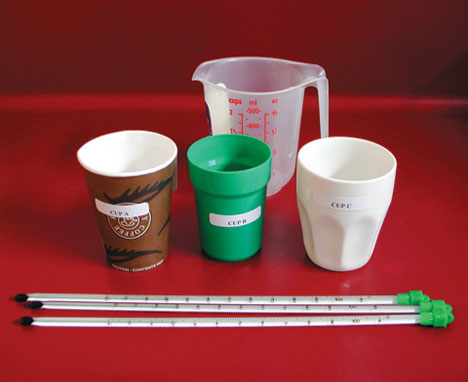
| Used water at same temperature (e.g. pour into cups quickly one after another): |
in plan and implemented |
36 |
||||||||||||
in plan, but not followed through |
6 |
|||||||||||||
not in plan, but implemented in experiment |
45 |
|||||||||||||
not mentioned or done |
13 |
|||||||||||||
| Put the same amount of hot water into each cup: |
in plan and implemented |
54 |
||||||||||||
in plan, but not followed through |
3 |
|||||||||||||
not in plan, but implemented in experiment |
15 |
|||||||||||||
not mentioned or done |
28 |
|||||||||||||
| Time from when water
was added: |
in plan and implemented |
52 |
||||||||||||
in plan, but not followed through |
7 |
|||||||||||||
not in plan, but implemented in experiment |
18 |
|||||||||||||
not mentioned or done |
23 |
|||||||||||||
| Took initial temperature in three cups soon
after cups were filled: |
in plan and implemented |
21 |
||||||||||||
in plan, but not followed through |
8 |
|||||||||||||
not in plan, but implemented in experiment |
24 |
|||||||||||||
not mentioned or done |
47 |
|||||||||||||
| Took temperatures in three cups at later times
after cups were filled: (recorded time and temperature) |
in plan and implemented |
58 |
||||||||||||
in plan, but not followed through |
4 |
|||||||||||||
not in plan, but implemented in experiment |
10 |
|||||||||||||
not mentioned or done |
28 |
|||||||||||||
| Took at least three temperature measurements in each cup after cups were filled: |
in plan and implemented |
27 |
||||||||||||
in plan, but not followed through |
1 |
|||||||||||||
not in plan, but implemented in experiment |
7 |
|||||||||||||
not mentioned or done |
65 |
|||||||||||||
| Took temperatures in three cups nearly simultaneously each time temperature was taken: (or at same interval after filling) |
in plan and implemented |
42 |
||||||||||||
in plan, but not followed through |
1 |
|||||||||||||
not in plan, but implemented in experiment |
31 |
|||||||||||||
not mentioned or done |
26 |
|||||||||||||
| Made table/chart/graph of change in temperature
across time: |
in plan and implemented |
39 |
||||||||||||
in plan, but not followed through |
5 |
|||||||||||||
not in plan, but implemented in experiment |
30 |
|||||||||||||
not mentioned or done |
26 |
|||||||||||||
| RESULTS AND CONCLUSION: |
||||||||||||||
Report matches observations: |
fully |
34 |
||||||||||||
moderately |
38 |
|||||||||||||
poorly |
28 |
|||||||||||||
initial drop in temperature when cups are filled was reported (first temperature recording) |
24 |
|||||||||||||
report explicitly deals with different rates of cooling |
37 |
|||||||||||||
report appropriately identifies cup that keeps water warmest for longest amount of time |
53 |
|||||||||||||
| Ideas for improvement if done again: |
two or more useful suggestions |
18 |
||||||||||||
one useful suggestion |
41 |
|||||||||||||
no useful suggestions |
41 |
|||||||||||||
Total
score: |
17–21 |
13 |
||||||||||||
13–16 |
27 |
|||||||||||||
9–12 |
29 |
|||||||||||||
5–8 |
22 |
|||||||||||||
0–4 |
9 |
|||||||||||||
| Commentary: |
| Because this is a team task, no graph of subgroup performance is possible. This was quite a challenging experimental task, complicated by the high thermal mass of the ceramic cup (which caused an immediate drop in temperature when filled).
The performances of the teams of year 8 students were very diverse. |