|
|||||||||||||||
|
|||||||||||||||
%
responses 2007 ('03) |
|||||||||||||||
y4 |
y8 |
||||||||||||||
 [Click on graphic to enlarge.] |
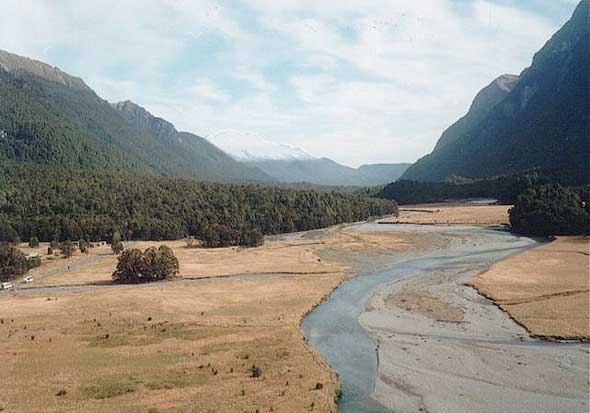
Show picture 1. Here is a picture of part of a river. Illustration sourced, with thanks, from: © Flying Fish. Available: http://www.flyingfish.co.nz/new_zealand_photo_library202/ rivers_and_gorges1/k033.jpg (March, 2002). |
||||||||||||||
| 1. Where could this river have started? |
|||||||||||||||
mountains/hills/glacier |
14 (21) |
39 (41) |
|||||||||||||
(small) streams |
5 (5) |
7 (3) |
|||||||||||||
spring/underground source |
2 (1) |
4 (2) |
|||||||||||||
(inland) lake/dam |
11 (11) |
18 (15) |
|||||||||||||
| 2. Where could this river end up? | |||||||||||||||
sea/ocean |
49 (55) |
75 (73) |
|||||||||||||
lake/dam |
14 (14) |
28 (25) |
|||||||||||||
another river |
4 (5) |
6 (9) |
|||||||||||||
 [Click on graphic to enlarge.] |
Show picture 2. [substitute resource due to copyright.] Over a long time this river has changed the land that it is running through. 3. How has the land changed because of the river? 4. How has the river caused those changes? Illustration sourced, with thanks, from: © Flying Fish. Available: http://www.flyingfish.co.nz/new_zealand_photo_library202/ rivers_and_gorges1/k016.jpg (May, 2008). |
||||||||||||||
| Mentioned: |
Erosion effects: (wearing away of soil/rock, creating valleys/cliffs) |
detailed response |
3 (6) |
14 (16) |
|||||||||||
mentioned |
13 (13) |
28 (28) |
|||||||||||||
not mentioned |
84 (81) |
58 (56) |
|||||||||||||
Depositing effects: (rocks, soil, timber left downstream, creating gravel, plains, broad valleys) |
detailed response |
1 (1) |
3 (2) |
||||||||||||
mentioned |
6 (3) |
14 (17) |
|||||||||||||
not mentioned |
93 (96) |
83 (81) |
|||||||||||||
effects of steepness/speed of flow
(high erosion in steep areas,
depositing in flat areas) |
1 (2) |
7 (5) |
|||||||||||||
irrigation effects (providing water for vegetation/animals) |
14 (12) |
15 (21) |
|||||||||||||
soil benefits in valleys / plains
from periodic flooding |
0 (1) |
1 (3) |
|||||||||||||
Total
score: |
4–14 |
6 (7) |
31 (31) |
||||||||||||
3 |
12 (15) |
19 (17) |
|||||||||||||
2 |
21 (24) |
23 (28) |
|||||||||||||
1 |
35 (30) |
20 (16) |
|||||||||||||
0 |
26 (24) |
7 (8) |
|||||||||||||
| Subgroup Analysis [Click on charts to enlarge] : |
Year 4 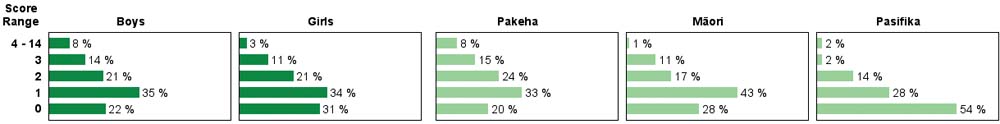 |
||
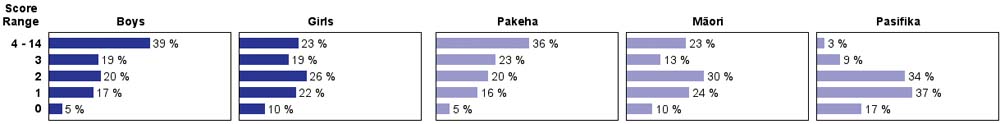
| Commentary: |
| This task showed substantial improvements in performance from year 4 to year 8, with little change at either level between 2003 and 2007. Boys performed significantly better than girls at both year levels, while year 8 Pasifika students averaged lower than the other groups. |