|
||||||||||
|
||||||||||
|
||||||||||
|
%
responses
2001 ('97) |
||||||||||
|
y4
|
y8
|
|||||||||
|
Included
ideas related to:
|
climate
|
24 (18) |
32
(40)
|
|||||||
|
population/people
|
22 (25) |
42
(49)
|
||||||||
|
geography/landscape,
scenery/cities/ environment/flora/fauna
|
61 (31) |
72
(70)
|
||||||||
|
Mäori
|
4 (3) |
10
(2)
|
||||||||
|
Samoans
in New Zealand
|
1 (1) |
3
(4)
|
||||||||
|
food
|
25 (25) |
28
(35)
|
||||||||
|
housing
|
31 (29) |
29
(37)
|
||||||||
|
transport
|
14 (16) |
9
(13)
|
||||||||
|
sports/recreation/leisure
|
27 (23) |
38
(36)
|
||||||||
|
schooling/education
|
18 (23) |
28
(40)
|
||||||||
|
clothing
|
9 (17) |
10
(27)
|
||||||||
|
language
|
8 (12) |
15
(16)
|
||||||||
|
religion
|
1 (1) |
3
(4)
|
||||||||
|
health
|
2 (0) |
2
(1)
|
||||||||
|
economy/jobs/commerce
|
15 (18) |
12
(31)
|
||||||||
|
other
cultural features
|
10 (9) |
28
(34)
|
||||||||
|
explicit
comparisons of Samoa and New Zealand
|
9 (8) |
14
(21)
|
||||||||
|
Total
number of appropriate ideas:
|
8 or more
|
4 (1) |
14
(19)
|
|||||||
|
6–7
|
10 (9) |
21
(23)
|
||||||||
|
4–5
|
29 (22) |
34
(39)
|
||||||||
|
2–3
|
40 (37) |
21
(17)
|
||||||||
|
0–1
|
17 (31) |
10
(2)
|
||||||||
|
Overall
rating :
|
(what
to expect in NZ) excellent/very good
|
3(1) |
11
(18)
|
|||||||
|
good
|
17 (8) |
29
(30)
|
||||||||
|
moderate
|
34 (34) |
39
(42)
|
||||||||
|
poor
|
46 (57) |
21
(10)
|
||||||||
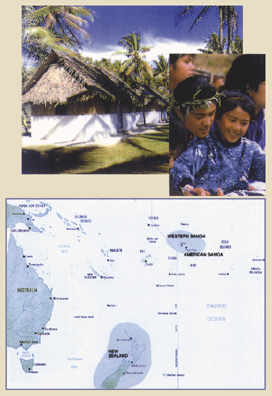
| Commentary: Only 20 percent of year 4 students and 40 percent of year 8 students were rated as having provided a good, very good or excellent description of New Zealand for these Samoan immigrants. Year 4 students did a little better in 2001 than in 1997 but the converse was true for year 8 students. |
| |
||
