|
||||||||||
|
|||||||||||||||||||||||
| Questions/instructions: | |||||||||||||||||||||||
|
|||||||||||||||||||||||
|
|||||||||||||||||||||||
| %
responses 2005 (01) |
|||||||||||||||||||||||
| y4 |
y8 |
||||||||||||||||||||||
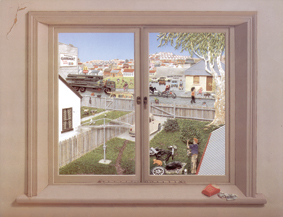
| 1.
What did you think were 3 of the main changes seen through the window
from when Rodney was a baby?
|
|||||||||||||||||||||||
How
well has the team captured the main changes? |
very
well |
7
(5) |
19
(15) |
||||||||||||||||||||
moderately
well |
21
(17) |
51
(37) |
|||||||||||||||||||||
a
little |
49
(43) |
21
(46) |
|||||||||||||||||||||
any
other response |
23
(35) |
9
(2) |
|||||||||||||||||||||
| 2. What did you think were 3 of the main reasons why the changes happened? | |||||||||||||||||||||||
How
well has the team identified the causes for the changes? |
very
well |
1
(0) |
8
(3) |
||||||||||||||||||||
moderately
well |
12
(3) |
37
(27) |
|||||||||||||||||||||
a
little |
46
(30) |
43
(52) |
|||||||||||||||||||||
any
other response |
41
(67) |
12
(18) |
|||||||||||||||||||||
| 3. What did you think were 3 of the good things that would happen with the changes? | |||||||||||||||||||||||
How
well has the team identified the positive consequences of the changes?
|
very
well |
3
(0) |
8
(3) |
||||||||||||||||||||
moderately
well |
12
(7) |
35
(12) |
|||||||||||||||||||||
a
little |
35
(31) |
41
(60) |
|||||||||||||||||||||
any
other response |
50
(62) |
16
(25) |
|||||||||||||||||||||
| 4. What did you think were 3 of the not so good things that would happen with the changes? | |||||||||||||||||||||||
How
well has the team identified the negative consequences of the changes? |
very
well |
8
(0) |
19
(5) |
||||||||||||||||||||
moderately
well |
18
(13) |
47
(37) |
|||||||||||||||||||||
a
little |
48
(44) |
27
(56) |
|||||||||||||||||||||
any
other response |
26
(43) |
7
(2) |
|||||||||||||||||||||
Total
score: |
10–12 |
3
(0) |
12
(5) |
||||||||||||||||||||
8–9
|
5
(2) |
20
(7) |
|||||||||||||||||||||
6–7
|
12
(6) |
35
(33) |
|||||||||||||||||||||
4–5
|
25
(19) |
18
(30) |
|||||||||||||||||||||
2–3
|
33
(33) |
7
(25) |
|||||||||||||||||||||
0–1
|
22
(40) |
8
(0) |
|||||||||||||||||||||
| Commentary: Both year 4 and year 8 students scored substantially higher in 2005 than in 2001. Whereas 20 percent of year 4 students obtained a total score of six or more, 67 percent of year 8 students reached that level. |


