|
||||||||||
|
|||||||||||
| Questions/instructions:
|
|||||||||||
| %
responses 2006 ('02) |
|||||||||||
| y4 |
y8
|
||||||||||
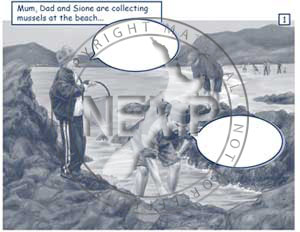
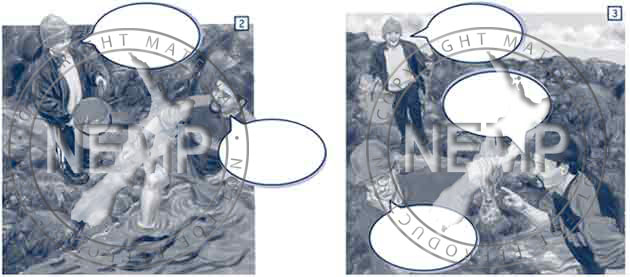
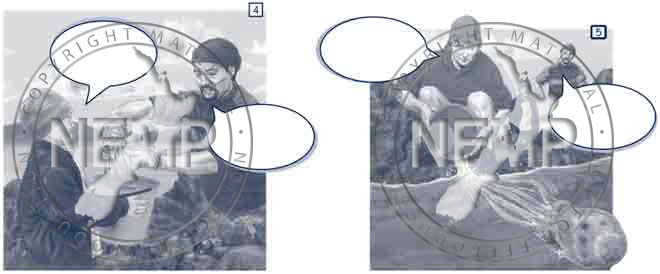
| How many individual speeches
fitted with pictures? (11 in total) |
all or most |
85 (84) |
95 (93) |
||||||||
about half of them |
12 (12) |
5 (6) |
|||||||||
few or none |
3 (4) |
0 (1) |
|||||||||
Extent to which series of
speeches told the story: |
very well |
32 (13) |
47 (39) |
||||||||
quite well |
50 (52) |
45 (48) |
|||||||||
slightly |
16 (33) |
8 (12) |
|||||||||
not at all |
2 (2) |
0 (1) |
|||||||||
| Extent to which series of
speeches sounded like an
interactive conversation: |
high |
60 (36) |
73 (57) |
||||||||
moderate |
33 (50) |
25 (35) |
|||||||||
low |
7 (14) |
2 (8) |
|||||||||
| Writing conventions
followed: |
consistently |
8 (0) |
23 (23) |
||||||||
about half of time |
25 (22) |
37 (30) |
|||||||||
rarely or never |
67 (78) |
40 (47) |
|||||||||
Total
score: |
8–9 |
18 (5) |
40 (34) |
||||||||
6–7 |
45 (36) |
40 (36) |
|||||||||
4–5 |
26 (42) |
17 (23) |
|||||||||
0–3 |
11 (17) |
3 (7) |
|||||||||
| Subgroup Analysis: |
Year 4 |
||
Year 8 |
| Commentary: |
| Most students met the core expressive requirements of this task very well or quite well but fewer followed writing conventions well. There was substantial improvement from 2002 to 2006 for year 4 students and a little improvement for year 8 students. Girls and Pasifika students were prominent among the high scores, especially at year 8 level. Pasifika students had a wide range of performance. |
|
|
||


